

Shiba Inu (SHIB) is showing signs of bullish revival after a substantial whale-driven accumulation coincided with a 17% price rebound from its 16-month low. Despite consolidation within a descending triangle pattern, recent price and volume dynamics point to a potential breakout.
Whale Activity Signals Confidence
On June 24, SHIB whales purchased over 10.4 trillion tokens, equivalent to more than $110 million, in what was the largest single-day accumulation in five months. This move came after SHIB dipped to a 16-month low of $0.00001005, triggering bargain buying by large holders.
The massive accumulation indicates renewed investor confidence and may act as a catalyst for continued upside, especially if macro sentiment remains stable.
Market Recovery and Volume Surge
The crypto market stabilized following the ceasefire between Israel and Iran. Bitcoin’s rebound above $106,000 supported sentiment across altcoins, including SHIB.
From June 24 (09:00) to June 25 (08:00), SHIB saw trading volume spike to 439 billion, well above its daily average. The token held firm around the $0.00001158–$0.00001162 zone, suggesting strong accumulation at support levels.
A key resistance level stands at $0.00001175. A decisive break above this could open the door to retest the June 16 high near $0.00001230.
Technical Analysis: Descending Triangle in Play
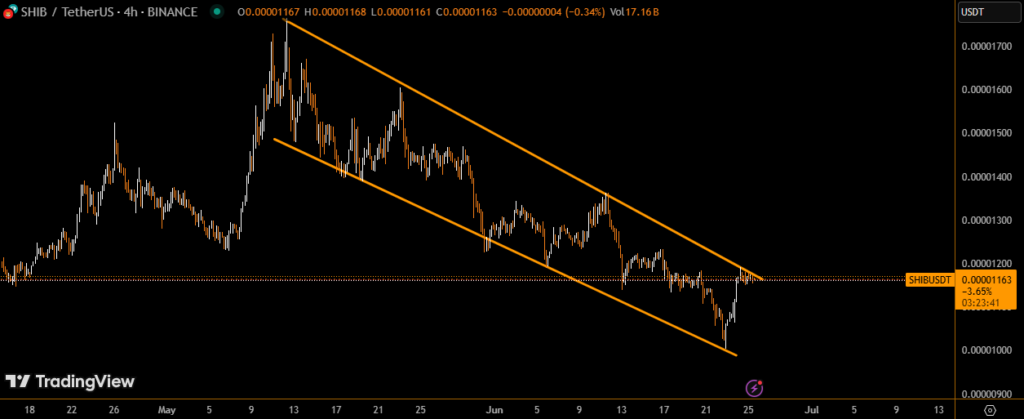
SHIB’s hourly chart now reflects a descending triangle — a bearish pattern formed by a downward-sloping resistance line and a flat support level near $0.00001160–$0.00001162.
A break above the descending trendline could signal a bullish continuation, potentially targeting $0.00001230+.
However, a breakdown below horizontal support may confirm a bearish reversal, risking a move back toward recent lows.
Still, higher lows over the past week suggest a subtle uptrend channel, reinforcing the view of buying interest at dips.
Outlook: Breakout or Breakdown?
While SHIB trades within a tight technical range, whale accumulation, elevated volume, and broader market recovery may favor bullish resolution of the pattern.
Traders should watch for a breakout above $0.00001175 or breakdown below $0.00001160 to gauge short-term direction.
Disclaimer
This content is for informational purposes only and does not constitute financial, investment, or legal advice. Cryptocurrency trading involves risk and may result in financial loss.