

Bitcoin (BTC) has pulled back to around $113,700, triggering anxiety among traders. However, on-chain metrics and technical indicators suggest this correction may be a natural part of a bullish continuation, not the start of a prolonged downtrend.
Glassnode Data Points to a “Healthy Reset”
According to Glassnode, the Short-Term Holder Spent Output Profit Ratio (STH-SOPR) currently reads 0.34, indicating most recent transactions are occurring at a loss. This is typically seen during capitulation phases, where weak hands exit and stronger hands enter.
Analysts at Swissblock note that Bitcoin remains well below overheated territory, historically associated with local tops. Instead, BTC appears to be cooling off after a strong Q2 rally—a healthy phase that could rebuild momentum for another leg up.
Lower Highs, Lower Lows—but No Panic
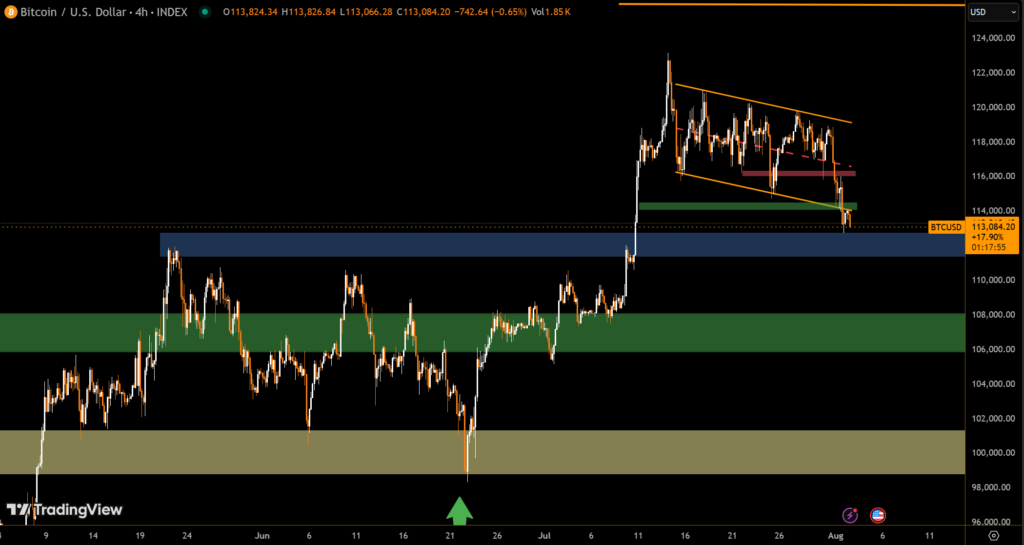
TradingView charts confirm a week-long series of lower highs and lows, yet Bitcoin is stabilizing above the $113,000 level. This price behavior, while short-term bearish, aligns with normal market cycles after extended uptrends.
Traders should also note the absence of panic volume, which often precedes major trend reversals.
RSI Shows Mild Bearish Pressure
The Relative Strength Index (RSI) now hovers between 43 and 47, just below neutral. This signals weak bearish momentum, but not a deep oversold condition—offering a potential buy zone for traders anticipating the next rebound.
Outlook: Accumulation Before Next Move?
If sentiment improves and macro headwinds remain stable, Bitcoin could find strong support in the $112K–$114K range. This zone has historically acted as an accumulation area before breakout attempts.
For now, Bitcoin’s correction looks more like a pitstop than a full stop.
Disclaimer
This content is for informational purposes only and does not constitute financial, investment, or legal advice. Cryptocurrency trading involves risk and may result in financial loss.