

Market structure signals exhaustion, but traders watch for a potential higher-timeframe reversal
SHIB Technical Analysis (Weekly Chart)
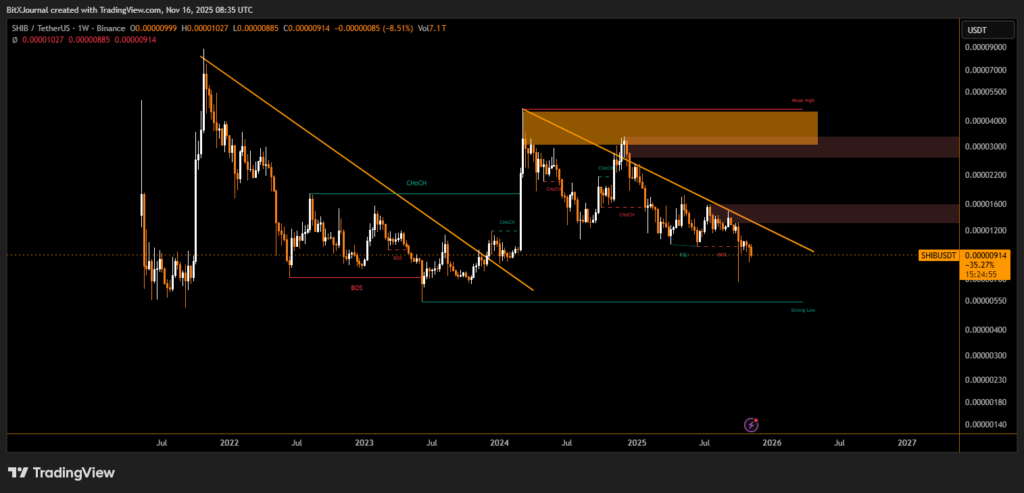
Shiba Inu (SHIB) continues to trade under heavy technical pressure as the weekly chart shows the token moving directly into a major long-term descending trendline while testing a critical support zone that has historically defined structural turning points. The latest weekly candle indicates growing volatility, with the market dipping below a major equilibrium level before closing back above it. Analysts say this behavior reflects weak liquidity, trend exhaustion, and the potential early stages of a structural reset.
Long-Term Downtrend Still Intact
The chart shows SHIB respecting a multi-year descending trendline stretching from its 2021 peak. Each rally attempt since mid-2023 has failed to break this line, reinforcing the prevailing bearish structure.
BitXJournal market technician noted, “SHIB remains in a controlled downtrend. Until the market decisively breaks the long-term diagonal, bullish momentum will remain limited.”
A series of lower highs and repeated Change of Character (CHoCH) signals highlight hesitation from buyers, confirming that SHIB remains in a redistribution phase rather than accumulation.
Key Support Re-tested as Market Forms Strong Low
The weekly structure shows SHIB revisiting a major support region that aligns with a previously marked Strong Low. Price briefly swept beneath this level before recovering, a move often associated with liquidity grabs.
“When price takes out a low and quickly reclaims the zone, it suggests that sellers may be weakening and liquidity is shifting back into buyer hands,” BitXJournal strategist commented.
The appearance of this sweep near long-term support is significant because it mirrors historical bottom formations within SHIB’s macro-cycle.
Imbalance Zones and Future Targets
Two major supply zones remain overhead:
- A wide cluster around 0.000016–0.000022,
- A higher zone near 0.000032–0.000042, labeled as a weak high region.
These zones represent areas where price previously dropped sharply, leaving large imbalances. Any bullish reversal would likely target these regions first before challenging the descending trendline.
SHIB is currently positioned at a technically pivotal level. The market is still bearish, but the combination of a support sweep, weakening downside momentum, and persistent liquidity grabs may indicate early signs of long-term accumulation.
For now, traders are watching for a weekly close above the descending trendline, which would mark the first major structural shift since 2022 and potentially open the path toward higher supply zones.
Disclaimer
This content is for informational purposes only and does not constitute financial, investment, or legal advice. Cryptocurrency trading involves risk and may result in financial loss.