

Market structure shows weakening momentum with traders watching critical demand blocks for the next major move
Introduction
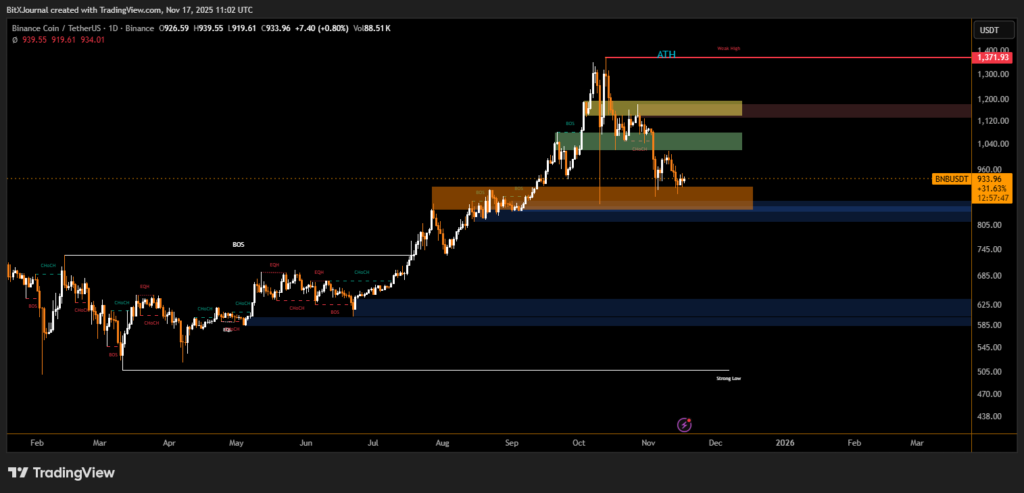
BNB is trading below the $1,000 level, signaling a notable shift in market momentum after months of strong upside. Recent price action, as shown in the chart, highlights a clear rejection from the $1,300–$1,370 zone, with the token now retesting deeper demand areas that previously fueled its breakout rally. Traders are closely evaluating whether BNB can hold these key levels or if further downside remains likely.
BNB Technical Overview
Current market structure shows that BNB has formed a series of Break of Structure (BOS) and Change of Character (CHoCH) signals, indicating a transition from bullish dominance into a potential distribution phase. After forming a weak high near the all-time high region, the price sharply retraced into an important mid-range demand block around $900–$950, which the market is currently testing.
The chart also illustrates multiple liquidity zones. The upper supply zones between $1,120 and $1,250 remain unmitigated, suggesting strong bearish pressure above. Below current price levels, wider daily demand bands between $780 and $830 and a deeper $620–$675 zone represent areas where significant buy-side interest previously emerged.
BitXJournal Market analyst commentary reflects caution. One technical strategist noted that the recent retracement shows “a clean shift in structure, where buyers are losing initiative and sellers are beginning to drive price toward untested demand zones.”
Why These Levels Matter
BNB’s market structure suggests traders are reacting strongly to established institutional zones. The chart highlights how mitigation blocks have repeatedly triggered directional moves, and the current interaction around $900 may determine whether the market seeks deeper liquidity.
Key areas remain under close watch:
- Immediate support: $900–$950
- Stronger demand: $780–$830
- Macro support: $620–$675
These levels are marked as historically significant points that facilitated previous bullish breakouts.
BitXJournal expert emphasized that intermediate support around $900 is crucial, adding that “a decisive breakdown from this region could open the path toward the broader liquidity pool sitting below $800.”
BNB trading below $1,000 underscores a shift toward uncertainty as the token approaches major support zones. The unfolding price action will reveal whether buyers can defend these regions or if the market will continue its corrective movement toward deeper daily demand levels. The coming days will be critical as structure-based signals continue to guide trader sentiment.
Disclaimer
This content is for informational purposes only and does not constitute financial, investment, or legal advice. Cryptocurrency trading involves risk and may result in financial loss.