

Bitcoin extended its decline to $90,000, marking one of its steepest resets in recent months as sellers broke through multiple structural supports. The move reflects a broader deterioration in short-term momentum, with the daily chart revealing a sequence of lower highs, weakening demand zones, and repeated failures at the upper resistance bands.
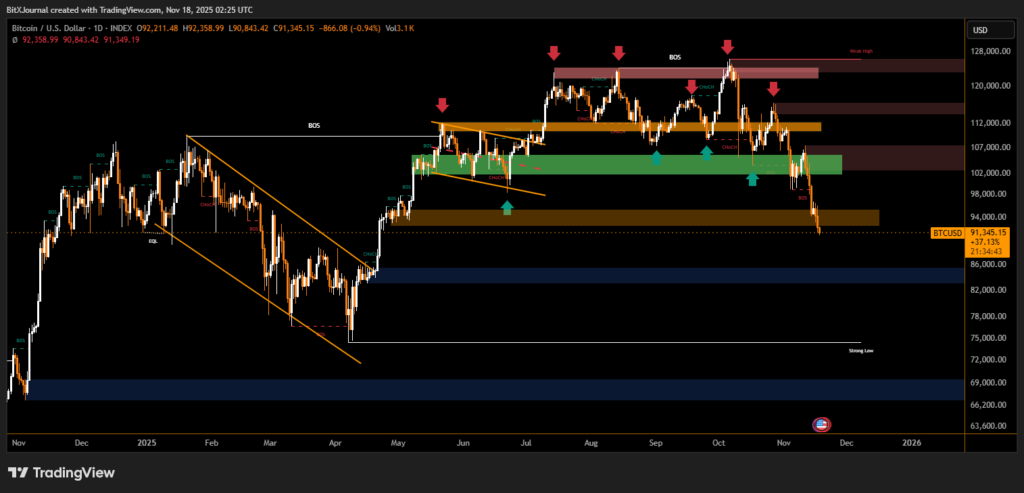
Bitcoin Technical Breakdown
The chart shows a clear BOS sequence, with Bitcoin losing the crucial $102,000–$104,000 demand area after several attempts to hold above it earlier in the quarter. The breakdown accelerated once price slipped below the mid-range consolidation, forming a direct path toward the lower liquidity pocket highlighted on the chart.
Analysts tracking the move say the momentum loss has been developing for weeks. BitXJournal market technician noted, “The repeated rejections from the $118,000–$125,000 supply zone established a structural ceiling. Each rejection produced a weaker bounce, which is a classic signal of declining buyer commitment.”
The chart’s cluster of red arrows highlights these failed rallies, each coinciding with a CHOCH reversal, confirming the pivot away from bullish structure.
The fall into the $90,000 zone marks the first clean test of this support since early summer, and the candles show a strong directional impulse, with little counter-pressure emerging on lower timeframes.
The chart also displays a deeper support band between $82,000 and $86,000, which served as the origin of the last major upside leg. BitXJournal quantitative strategist commented, “If $90,000 gives way, the price will naturally gravitate toward the high-volume region around $84,000. That area has historically produced aggressive reactions.”
Market Context and Key Levels
The broader trend remains in a descending formation, highlighted by the series of angled resistance lines on the chart. Until Bitcoin reclaims the broken mid-range at $102,000, the bearish pressure is likely to persist.
Important levels ahead:
• $90,000: Immediate support under pressure
• $94,000: Lost demand zone acting as fresh resistance
• $102,000: Structural recovery threshold
• $84,000: High-liquidity strong support zone
Conclusion
Bitcoin’s drop to $90,000 underscores a decisive shift in technical sentiment. With key supports breaking and momentum favoring sellers, the market now watches whether the next major demand block can stabilize price before deeper levels are tested.
Disclaimer
This content is for informational purposes only and does not constitute financial, investment, or legal advice. Cryptocurrency trading involves risk and may result in financial loss.