

Deepening Sell-Off Raises Concerns as Key Support Zones Come Into Focus
Bitcoin Market Pressure Intensifies
Bitcoin slid toward $81,000, extending its multi-week decline as U.S. spot Bitcoin ETFs recorded a historic wave of outflows totaling $3.79 billion, according to industry trackers. The downturn reflects a broader shift in investor sentiment, fueling additional volatility across major digital assets.
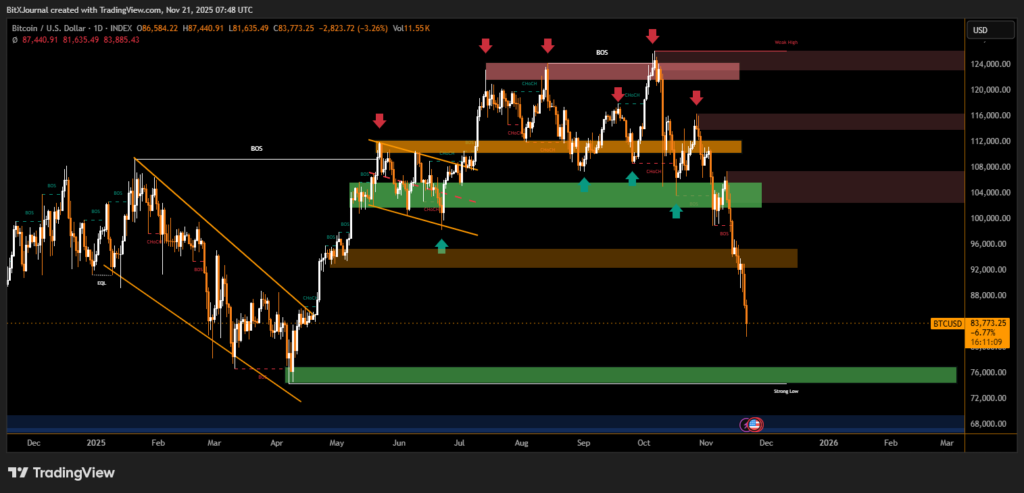
The chart provided shows Bitcoin breaking below several intermediate support regions, slipping from the $87,000–$90,000 consolidation area and accelerating downward. Market structure now leans decisively bearish, with price heading into a major demand zone near $78,000–$80,000.
BitXJournal Analysts say the reaction is unsurprising given current macro pressure. “When outflows reach this magnitude, it signals a realignment of institutional exposure rather than simple profit-taking,” one market strategist noted. He added that persistent ETF redemptions amplify downside momentum, especially when liquidity thins.
Record ETF Outflows Fuel Bearish Momentum
Bitcoin ETFs, once considered a stabilizing force, have become a source of selling pressure. Multiple funds saw multi-day withdrawals, marking the largest cumulative reduction since these products launched.
Experts warn that ETF outflows are now a leading short-term driver of volatility. As BitXJournal derivatives analyst explained, “You cannot ignore billions leaving the spot ETF market. It forces rebalancing across desks and destabilizes key support.”
This is evident in the price action:
- The $88,000 structure-break zone failed
- A rejection near $94,000–$96,000 confirmed bearish order flow
- Price is tracking toward a deeper liquidity pocket around $76,000–$78,500
These zones are underlined in the chart as major inflection points.
Technical Breakdown Accelerates Toward Strong Support
Bitcoin’s technical picture shows a clear deterioration. The chart illustrates multiple breaks of structure (BOS) and change-of-character (CHoCH) signals aligning with the downward shift. A series of lower highs and lower lows underscores the transition into a confirmed bearish trend.
Analysts highlight the strong support region at $76,000–$78,000 as the area to watch. “If Bitcoin holds this zone, buyers may attempt a recovery toward $88K. A clean breakdown, however, opens risk toward the mid-$60Ks,” a technical researcher commented.
What Comes Next for BTC?
Market participants are now watching:
- Whether ETF outflows stabilize
- Bitcoin’s reaction to the $78K support band
- Liquidity behavior in the derivatives market
- Short-term demand around $81K–$83K
With macro uncertainty, ETF outflows, and weakening technicals, Bitcoin remains vulnerable—yet deep liquidity zones below may offer the first real platform for a potential rebound.
Disclaimer
This content is for informational purposes only and does not constitute financial, investment, or legal advice. Cryptocurrency trading involves risk and may result in financial loss.