

XRP technical analysis highlights key support retest amid market-wide drawdown
XRP slipped nearly 6% in the past 24 hours, extending a multi-day correction as the broader digital asset market faced heavy selling pressure. The decline pulled the token toward a long-watched support region visible on the latest daily structure, where price has returned after a sequence of lower highs and successive breaks of market structure. Traders are now assessing whether the asset can stabilize or if a deeper move is forming.
Market Context
The latest selloff across major cryptocurrencies has impacted mid-cap assets heavily, and XRP is no exception. The chart shows a decisive break of structure, followed by continued downside movement into a demand zone that has historically provided relief. Analysts note that this area has acted as a reaction point in multiple cycles, making it a significant technical marker for traders.
BitXJournal market strategist explained that “the current pullback isn’t isolated; it reflects risk reduction across the entire crypto landscape.” He added that liquidity has thinned in recent sessions, prompting sharper moves.
Technical Breakdown
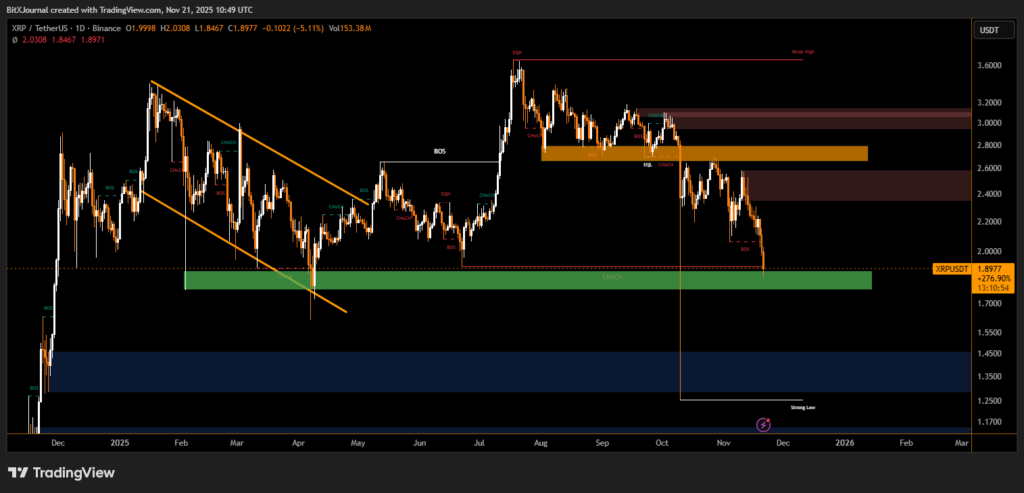
XRP’s decline accelerated after failing to reclaim a key supply region near the $2.60–$2.80 band, marked clearly on the chart by multiple rejected wicks and consolidation failures. The market then shifted with a series of clear change-of-character (ChoCH) signals, suggesting momentum was reversing.
The latest leg down has driven price into the green demand zone, historically aligning with bullish reactions. However, the presence of a lower weak low suggests the market is vulnerable if buyers fail to defend this area.
BitXJournal analysts focusing on structure-based trading noted, “If XRP loses this demand band, the next major inefficiency sits considerably lower. Bulls must hold this zone to avoid a broader trend continuation to the downside.”
The coming sessions will determine whether the token can reclaim intraday levels or if the market will press toward the deeper liquidity pocket highlighted on the chart.
The underlined areas of supply and demand remain the most important reference points as traders weigh whether this is a temporary correction or the start of a more prolonged retracement.
Disclaimer
This content is for informational purposes only and does not constitute financial, investment, or legal advice. Cryptocurrency trading involves risk and may result in financial loss.