

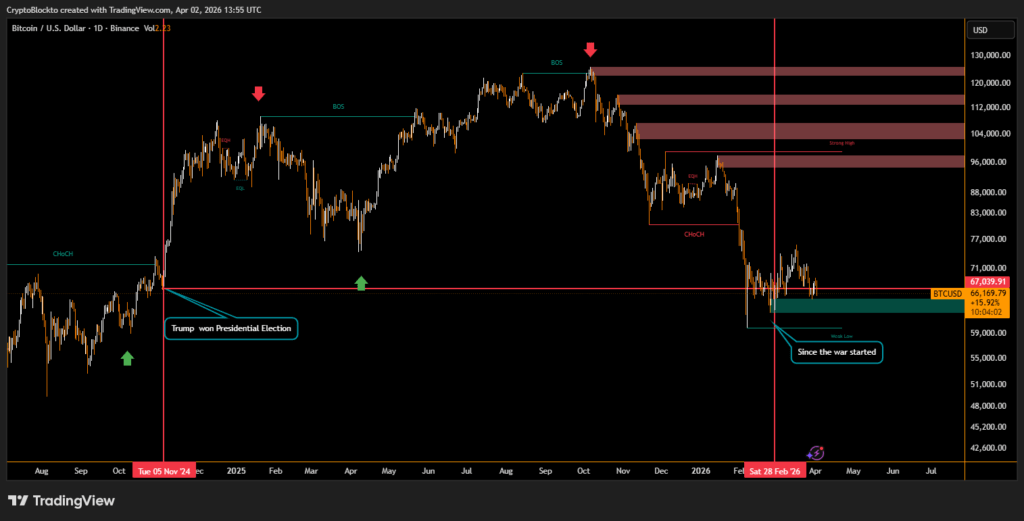
Bitcoin is trading below $66,000, down over 3% in the past 24 hours and roughly 45% below its October all-time high, marking nearly six months of a bear market. Investors are increasingly focused on two key questions: how much lower can bitcoin fall, and how long will this bear market continue.
Price Pain vs. Time Pain
Market challenges are not only about sharp drawdowns, known as price pain, but also slow-moving, range-bound trading, referred to as time pain. Price pain forces participants out of positions during sudden volatility, while time pain tests investor endurance as markets remain directionless for extended periods.
Long-Term Holder Dynamics
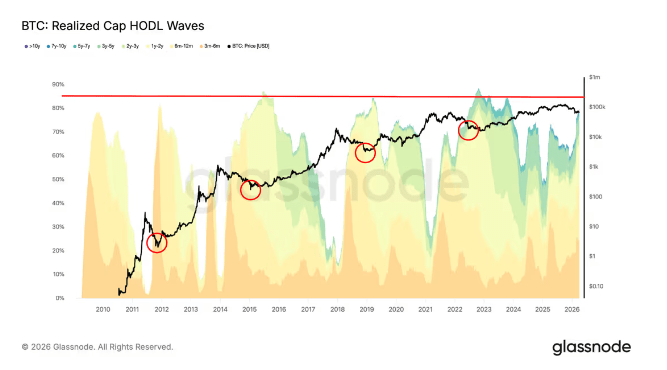
Realized Cap HODL Waves data groups bitcoin supply based on the last time coins moved and weights them by realized price. Currently, long-term holders those holding bitcoin for six months or more control around 80% of the total supply. Historical patterns indicate bear market bottoms coincide with long-term holders controlling about 85% of supply. This suggests that although the price floor may be forming, several months of sideways trading could still be ahead.
Implications for Investors
Long-term holders appear to be accumulating at depressed prices, which historically signals stabilization. However, past cycles show that while price bottoms may form first, it often takes months for long-term holder supply to reach peak levels. This indicates that investors should expect continued consolidation before a sustained recovery begins.
Disclaimer
This content is for informational purposes only and does not constitute financial, investment, or legal advice. Cryptocurrency trading involves risk and may result in financial loss.