

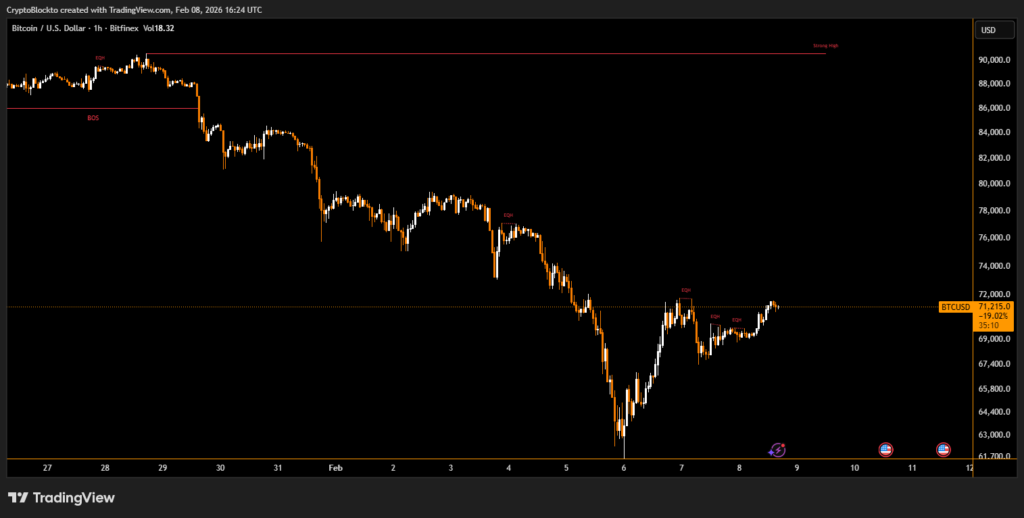
Bitcoin rebounded sharply over the weekend, climbing as much as 3% and recovering to the $71,000 level. Despite the bounce, several market analysts remain unconvinced that the recent sell-off marks the end of the broader bearish cycle.
Bitcoin Price Fractals Point to Deeper Macro Lows
Market comparisons with the 2022 bear market are fueling caution. Analysts tracking long-term price behavior note similarities between current price action and previous downturn patterns. One commonly cited signal is Bitcoin’s position relative to its 50-week exponential moving average, which currently sits near $95,000 — well above spot price.
According to bearish projections, Bitcoin has yet to experience a full capitulation phase similar to past cycles. Some traders argue that a “real bottom” could form below $50,000, particularly if selling pressure intensifies and leveraged positions are flushed out.
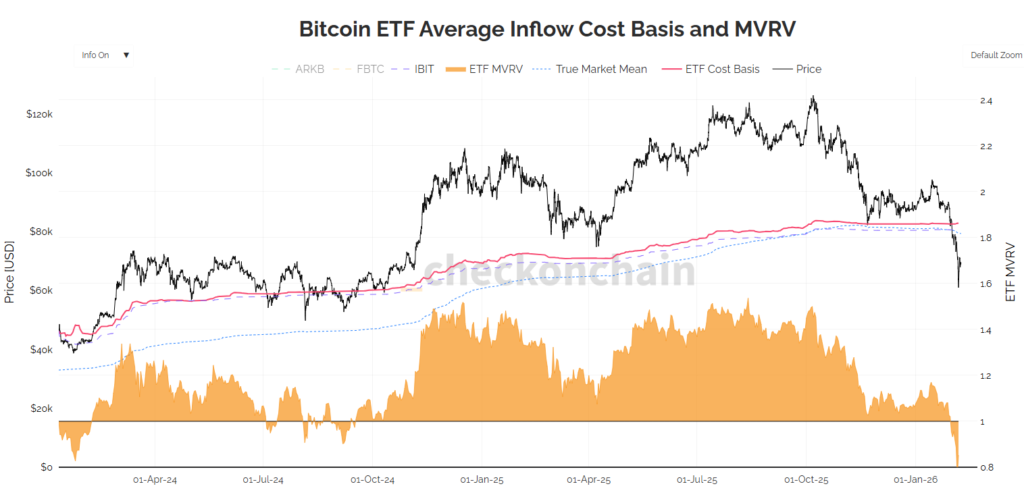
ETF Cost Basis and Long-Term Averages in Focus
Another key factor is the average cost basis of US spot Bitcoin ETFs, estimated around $82,000. A sustained move lower would leave a large portion of ETF holders underwater, historically a condition associated with late-stage bear markets.
Long-term indicators such as the 200-week simple and exponential moving averages are also drawing attention. These levels, forming a support zone between roughly $58,000 and $68,000, previously failed to hold during the 2022 downturn.
While historical parallels raise concerns, analysts caution that markets rarely repeat with perfect precision. Structural differences, including institutional participation and ETF flows, could alter the trajectory even if volatility remains elevated in the near term.
Disclaimer
This content is for informational purposes only and does not constitute financial, investment, or legal advice. Cryptocurrency trading involves risk and may result in financial loss.