

Bitcoin is heading toward its strongest weekly performance since September 2025, rising more than 7% over the past week while traditional equities declined. The cryptocurrency traded around $70,600 during the period, contrasting with the benchmark S&P 500, which dropped about 1.60%.
The divergence appeared amid a broader risk-off environment linked to escalating geopolitical tensions involving the United States and the Israel-Iran conflict. Despite the uncertain macro backdrop, Bitcoin continued to attract investor demand.
Strategy’s STRC Instrument Suggests New Bitcoin Buying Power
A major factor behind the recent momentum is the potential purchasing activity linked to Strategy’s STRC instrument. Data indicates the company may have raised enough capital through at-the-market sales of the income-paying security to purchase more than 11,000 Bitcoin.
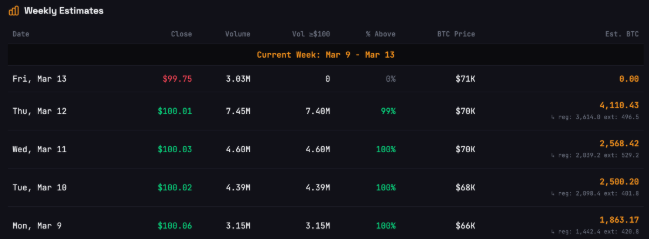
At current prices, this would translate to roughly $776 million worth of BTC. The STRC instrument allows the company to issue shares when they trade at or above the $100 par value, converting investor demand into additional capital for Bitcoin accumulation.
Last week the firm purchased 17,994 BTC, valued at around $1.28 billion at the time, with approximately 30% of that allocation funded by STRC proceeds.
Institutional Demand Supports Bitcoin Price
Institutional demand has also strengthened through exchange-traded funds. US spot Bitcoin ETFs recorded approximately $767 million in net inflows across five consecutive trading sessions, indicating steady interest from investors even during global uncertainty.
Historically, Bitcoin has often reacted to geopolitical conflicts with short-term declines followed by significant rebounds. Similar patterns were seen after the Russia-Ukraine conflict in 2022 and regional tensions in the Middle East during 2025.
Bear Flag Pattern Signals Possible Downside Risk
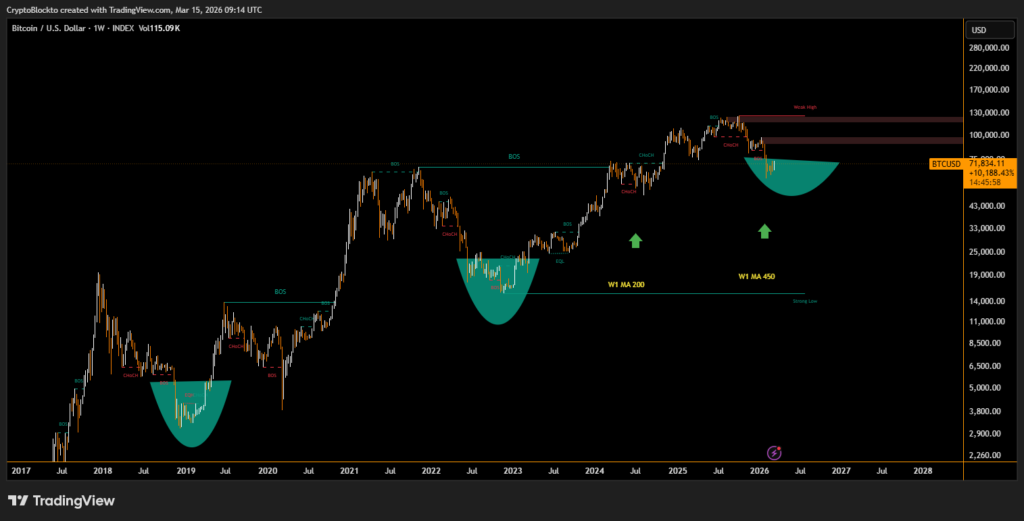
Despite the recent rally, technical indicators still point to potential downside risk. Bitcoin’s price movement has formed a bear flag pattern on the daily chart, a structure that sometimes signals a continuation of the previous downtrend.The pattern shows price rising inside a narrow ascending channel after a sharp decline. If Bitcoin breaks below the lower boundary of the formation, the measured downside target could fall toward the $51,000 level.

For now, the market remains balanced between growing institutional demand and technical signals suggesting caution.
Disclaimer
This content is for informational purposes only and does not constitute financial, investment, or legal advice. Cryptocurrency trading involves risk and may result in financial loss.