

DOG/USDT tests multi-month demand zone, analysts eye possible rebound or deeper breakdown
The weekly chart of DOG/USDT reveals mounting pressure at a critical support zone, as sellers continue to dominate the trend. After weeks of lower highs and consistent resistance rejections, the token is now hovering near its major demand area around the $0.0018 level.
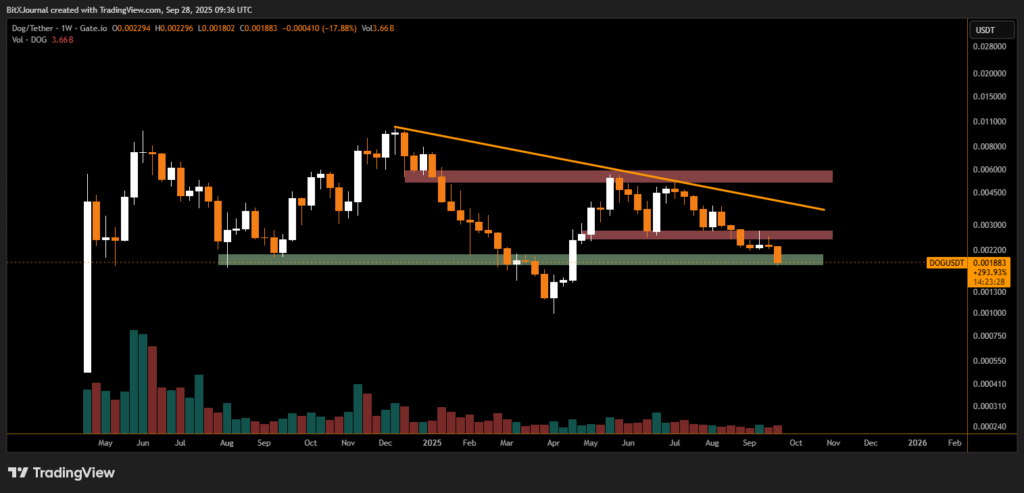
DOG has been in a prolonged downtrend marked by a descending resistance line, preventing any sustained bullish momentum since early 2025. The chart highlights repeated rejections from the $0.0045–$0.0060 resistance band, confirming this area as a major supply zone.
Currently, price action has retraced back to the green support region between $0.0018 and $0.0022, an area that previously sparked rebounds in September 2024 and April 2025. Losing this support on high volume could expose DOG to deeper downside toward the $0.0013 psychological level.
BITX Market analysts suggest that the token is at a make-or-break point. “If DOG holds this zone, a short-term bounce toward $0.0028 or even $0.0030 is possible. But a decisive weekly close below support will likely extend the bearish cycle.”
Volume data also reflects waning buying interest, with sellers maintaining control. However, some contrarian traders argue that the extreme compression could fuel a short-term reversal rally if buyers defend the current level.
For now, the trend remains bearish, with lower highs dominating the chart. Traders will be closely watching whether DOG can sustain above $0.0018 in the coming weeks. A rebound could see it retest mid-range resistances, but failure to hold may open the door to fresh yearly lows.
Disclaimer
This content is for informational purposes only and does not constitute financial, investment, or legal advice. Cryptocurrency trading involves risk and may result in financial loss.