
Price slips into major demand zone as volume thins, structural breaks deepen and recovery attempts fail
Hedera’s HBAR token is flashing new liquidity concerns after sliding to $0.1373, breaking below a key support region that previously acted as a springboard for bullish reversals. The latest move places the asset directly inside a high-timeframe demand zone, where buyers have historically intervened — but current market conditions suggest confidence is weakening.
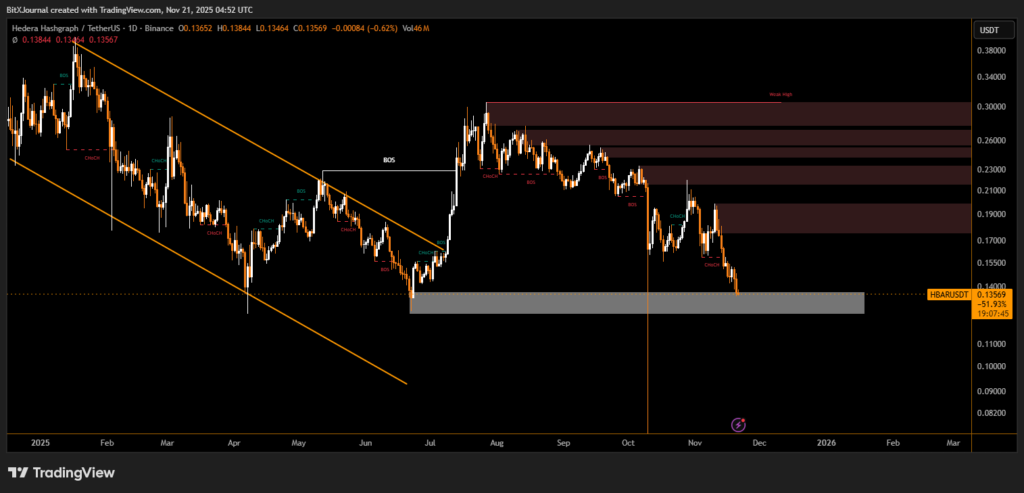
The daily chart reflects a clear deterioration in structure. A series of consecutive Breaks of Structure (BOS) and Change of Character (ChoCH) signals show sellers firmly in control throughout November. HBAR’s failure to reclaim mid-range liquidity zones between $0.17 and $0.19 underscores its declining momentum.
Liquidity Stress Intensifies
BitXJournal Market analysts say the latest breakdown was accompanied by collapsing volume and a late-session liquidity halt, indicating an increasingly fragile order book.
“When price enters a demand block with this level of volume compression, it tells you liquidity providers are stepping back,” said BitXJournal digital asset market strategist. “HBAR needs a decisive reaction here — otherwise the next sweep could target deeper inefficiency zones closer to $0.12.”
The chart also reveals a clear distribution phase around the $0.26–$0.30 region earlier this quarter, followed by consistent lower highs — a textbook signal of exhausted buying pressure. The rejection from this area created a structurally weak high, which has now turned into a strong magnet for future liquidity hunts.
Support Zone Now Under Pressure
The current gray demand zone between roughly $0.132 and $0.142 is the last major block before the market opens the door to a retest of historical lows. This zone held earlier in July, sparking a sharp upside rally, but conditions today are notably different.
“The broader market is in a risk-off mode, and assets like HBAR — which rely heavily on liquidity depth — are the first to show cracks,” BitXJournal analyst noted.
What Comes Next?
If HBAR fails to defend the current region, technical models suggest a slide toward untested imbalances left from Q1. Only a strong reclaim above $0.155 would invalidate the immediate bearish structure and signal that buyers are regaining control.
For now, the chart paints a picture of an asset fighting to maintain structural integrity amid tightening liquidity conditions — and the next few sessions could determine whether HBAR stabilizes or accelerates its decline.
Disclaimer
This content is for informational purposes only and does not constitute financial, investment, or legal advice. Cryptocurrency trading involves risk and may result in financial loss.