
 Faces 3% Decline as Technical Signals Suggest Key Test Ahead")
Support and resistance zones define HBAR’s next move
Hedera Hashgraph (HBAR) slipped by nearly 3% in the latest trading session, with the price consolidating around the $0.24 level against Tether (USDT). The move comes after a period of sideways trading, as technical indicators suggest the asset is approaching a critical decision point.
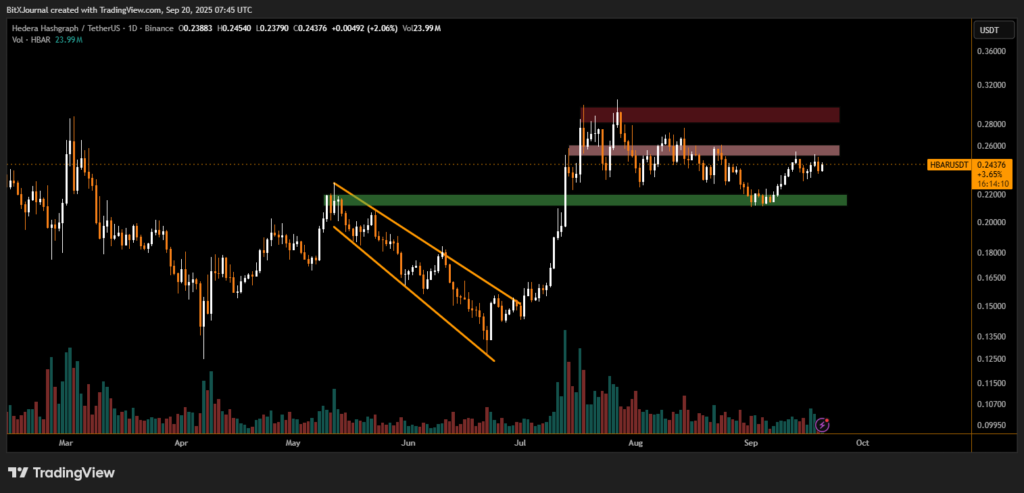
On the daily chart, HBAR recently broke out of a descending wedge pattern formed between May and June, sparking a sharp rally toward the $0.30 resistance zone. Since then, however, the price has repeatedly failed to sustain momentum above this level, creating visible supply zones between $0.27 and $0.30.
Meanwhile, demand has been established in the $0.21–$0.22 area, where buyers have consistently defended against deeper corrections. This back-and-forth has kept the token range-bound for much of August and September.
BITX Market watchers say HBAR’s current structure reflects a battle between short-term profit-taking and long-term accumulation.
“HBAR is consolidating after a strong mid-summer breakout. The $0.21 support is crucial — a breakdown could open the door toward $0.18, but a recovery above $0.27 might reignite bullish momentum,” said BITX digital asset strategist.
Key levels to watch
- Immediate support: $0.21–$0.22
- Resistance zone: $0.27–$0.30
- Potential downside target if support breaks: $0.18
For now, HBAR’s price action is defined by a tight supply and demand battle. If bulls manage to reclaim the $0.27 resistance with convincing volume, a retest of the $0.30 zone becomes likely. Until then, traders may continue to see volatility as the market decides its next major trend.
Disclaimer
This content is for informational purposes only and does not constitute financial, investment, or legal advice. Cryptocurrency trading involves risk and may result in financial loss.