

Technical outlook shows LTC consolidating between major supply and demand zones
Litecoin (LTC) is trading around $114 against USDT, holding within a defined range after failing to sustain momentum above $120. The chart structure highlights a critical battle between bulls and bears, with clear resistance near $125–$130 and a strong support zone around $105–$110.
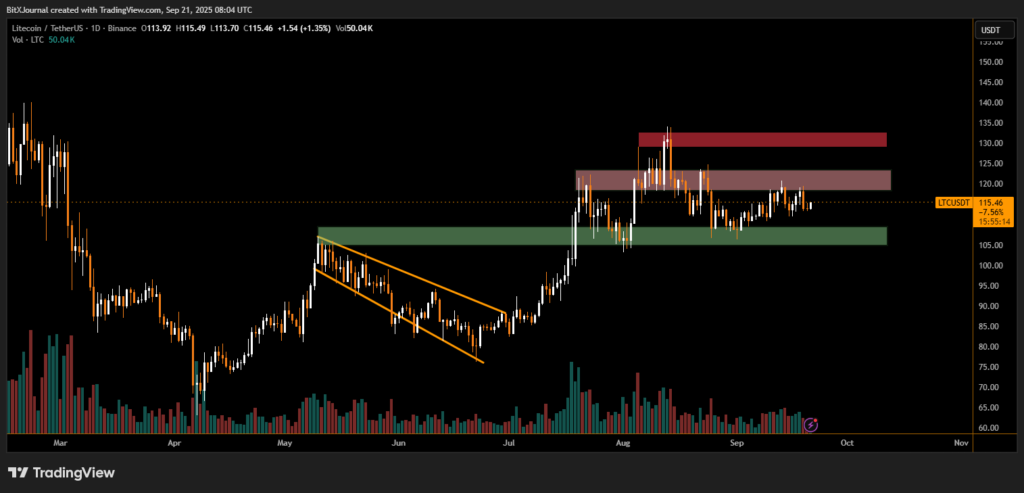
The daily chart shows that after breaking out of a falling wedge pattern in June, Litecoin staged a strong rally toward $130. Since then, price action has been consolidating, with repeated rejections at the supply zone between $125 and $130.
On the downside, the green demand zone around $105–$110 has acted as a cushion, preventing deeper declines. As long as this area holds, the bias remains moderately bullish.
“Litecoin’s structure is constructive as long as buyers protect the $105 level,” said BITX market analyst. “A decisive breakout above $125 could open the door for a move toward $135 and beyond.”
Trading volume has tapered off compared to July’s breakout phase, suggesting traders are waiting for confirmation before committing to new positions. The open range suggests accumulation, with buyers stepping in on dips but sellers capping rallies near resistance.
The short-term moving averages remain supportive, though failure to hold above $110 could shift momentum back in favor of sellers.
If Litecoin breaks above the $125 resistance zone, technical projections point to the next target near $135–$140. Conversely, a breakdown below $105 may trigger further downside toward the $95 area.
Litecoin remains in a consolidation phase between $110 support and $125 resistance. Traders are closely monitoring these levels, as a breakout could set the tone for the next major trend.
Disclaimer
This content is for informational purposes only and does not constitute financial, investment, or legal advice. Cryptocurrency trading involves risk and may result in financial loss.