

LTC Technical Analysis Signals Increased Volatility
Litecoin (LTC/USDT) faced heavy selling on Monday, dropping nearly 8% to trade around $105.16. The sudden decline erased recent gains and pushed the cryptocurrency toward a crucial support area that traders have been monitoring closely.
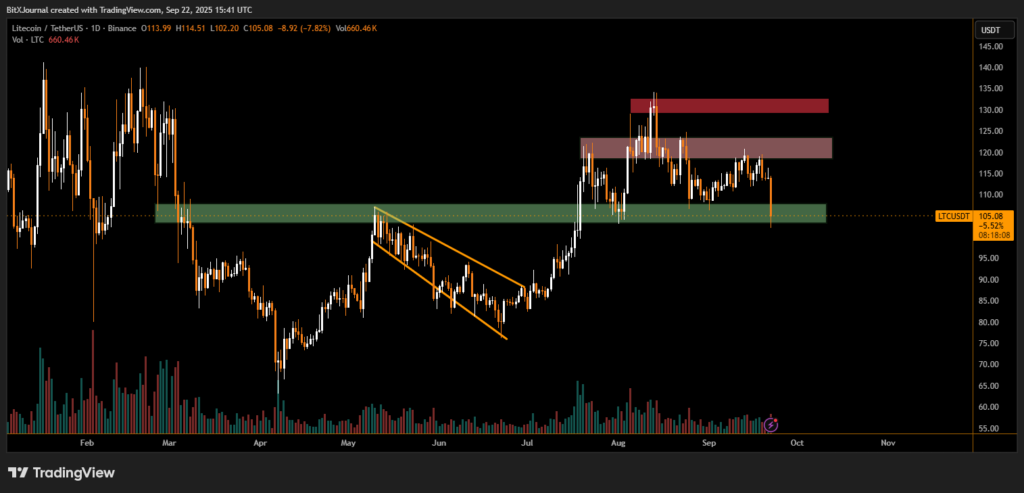
On the daily chart, Litecoin fell sharply after failing to sustain momentum near the $120–$125 resistance range, a zone that previously capped rallies earlier this month. The decline accelerated as sellers gained control, driving price action back into the $100–$105 support band highlighted by earlier consolidation.
“The current correction highlights how fragile sentiment remains in the altcoin market,” noted BITX market strategist. “Holding above the $100 region is critical. A decisive break below this zone could expose Litecoin to deeper losses toward the $90 level.”
Technical indicators show that volume spiked during the selloff, indicating stronger participation from bears. Price also slipped below short-term moving averages, a sign that short-term momentum has turned negative. If Litecoin holds the green support area, traders may look for a bounce back toward $115, but any recovery is likely to face resistance near $120.
According to BITX “Litecoin is still within a broad range despite today’s drop. Long-term investors will watch whether this pullback attracts buyers at lower levels or signals a more sustained downturn.”
The broader crypto market also showed signs of weakness, adding pressure to LTC. However, some experts suggest that oversold conditions could spark a relief rally if Bitcoin stabilizes and risk appetite returns.
For now, the key levels remain clearly defined: support at $100–$105 and resistance at $120–$125. A break on either side will likely dictate Litecoin’s next major move.
Disclaimer
This content is for informational purposes only and does not constitute financial, investment, or legal advice. Cryptocurrency trading involves risk and may result in financial loss.