
Photo: Illustrative
Bitcoin Crash Below $60K Could Delay Recovery Until 2027, Data Suggests
Bitcoin’s recovery timeline may extend significantly if the current selloff deepens, with historical data indicating that larger drawdowns require longer recovery periods. The asset has erased its March gains and is currently down 1.40% for the month and 24.6% in the first quarter of 2026, reflecting sustained bearish pressure.

Bitcoin’s recovery timeline may extend significantly if the current selloff deepens, with historical data indicating that larger drawdowns require longer recovery periods. The asset has erased its March gains and is currently down 1.40% for the month and 24.6% in the first quarter of 2026, reflecting sustained bearish pressure.
Analysts note that Bitcoin’s recent correction aligns with long-term drawdown cycles, with some projections pointing to a possible 40% additional decline. Such a move could push the next full recovery phase toward Q2 2027, depending on how low prices fall in the coming months.
Drawdown Depth and Recovery Timeline Trends
Market data shows a strong relationship between correction depth and recovery duration. Historical patterns suggest that every additional 10% drop adds roughly 80 days to the time required for Bitcoin to reclaim previous highs.
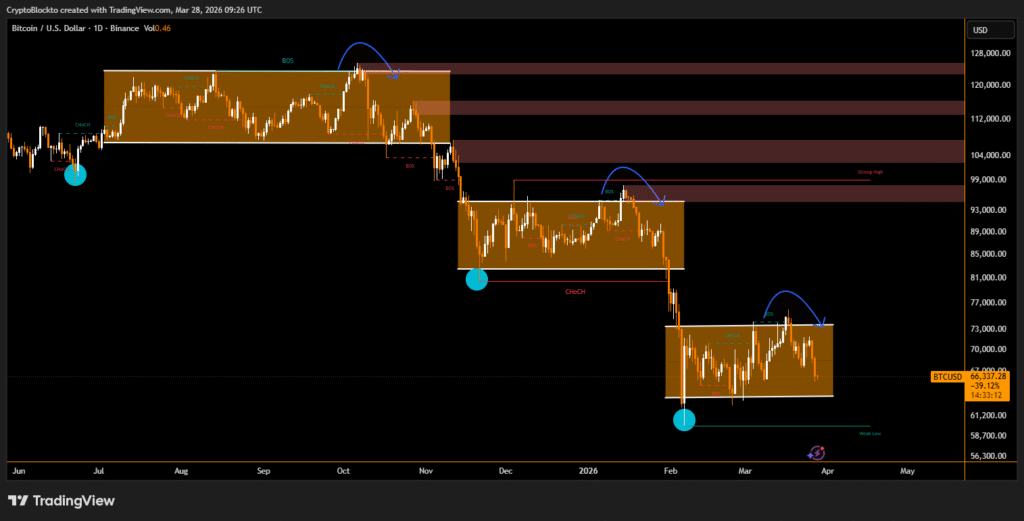
With Bitcoin currently near a 48% drawdown from its October 2025 peak of $126,000, the recovery cycle is estimated at around 300 days. Approximately 172 days have already passed, leaving about 125 to 130 days if the cycle low has formed near $60,000. However, indicators suggest the market may not have reached its bottom yet.
Market Indicators Signal Risk of Deeper Correction
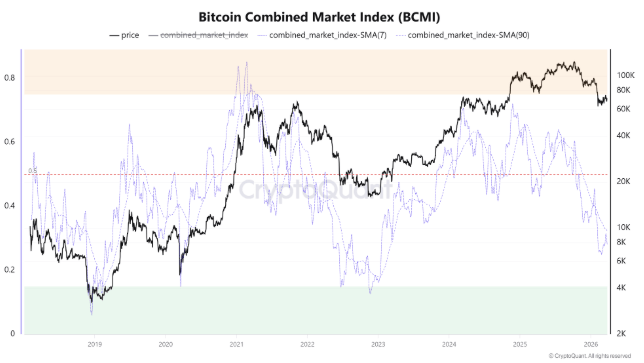
Key sentiment metrics remain above traditional bottom levels. The Bitcoin Combined Market Index (BCMI) currently stands near 0.27, compared with the 0.15 level historically associated with market bottoms since 2018.
Analysts also point to increasing selling pressure from large investors and weakening liquidity conditions. Some cycle models suggest potential downside toward the $40,000–$45,000 range, which would deepen the drawdown to 64%–68% from peak levels. If this scenario unfolds, historical models indicate Bitcoin’s next all-time high recovery could occur after Q2 2027, rather than in the near term.
Disclaimer
This content is for informational purposes only and does not constitute financial, investment, or legal advice. Cryptocurrency trading involves risk and may result in financial loss.
Live market reaction
Disclaimer
This content is for informational purposes only and does not constitute financial, investment, or legal advice. Cryptocurrency trading involves risk and may result in financial loss.
Start trading
with BloFin today
Up to $500 sign-up bonus and zero-fee trading on your first 30 days.
Buy crypto nowⓘ You will be redirected to BloFin
About the author
8+ years covering crypto markets, macro, and geopolitics. Previously at Decrypt and CoinDesk. Focused on the intersection of digital assets and traditional finance.

BitMine Expands Ethereum Holdings With $238M Purchase, Nears 5% Supply Target

Bitcoin Price Outlook: Why BTC Could Move Toward $95K After $80K Recovery

Trump-Linked World Liberty Files Defamation Case Against Justin Sun Over WLFI Token Dispute