
Photo: Illustrative
Bitcoin Falls Below $76K as Mixed Onchain Signals Cloud Market Direction
Bitcoin dropped below $76,000 after failing to break through the key $80,000 resistance level, with uncertainty surrounding the reopening of the Strait of Hormuz and broader macroeconomic concerns weighing on sentiment. The recent pullback followed a strong recovery of nearly 30% from sub-$60,000 lows recorded on Feb. 6, but selling pressure intensified in the $78,000 to $80,000 supply zone.
.jpeg)
Bitcoin dropped below $76,000 after failing to break through the key $80,000 resistance level, with uncertainty surrounding the reopening of the Strait of Hormuz and broader macroeconomic concerns weighing on sentiment. The recent pullback followed a strong recovery of nearly 30% from sub-$60,000 lows recorded on Feb. 6, but selling pressure intensified in the $78,000 to $80,000 supply zone.
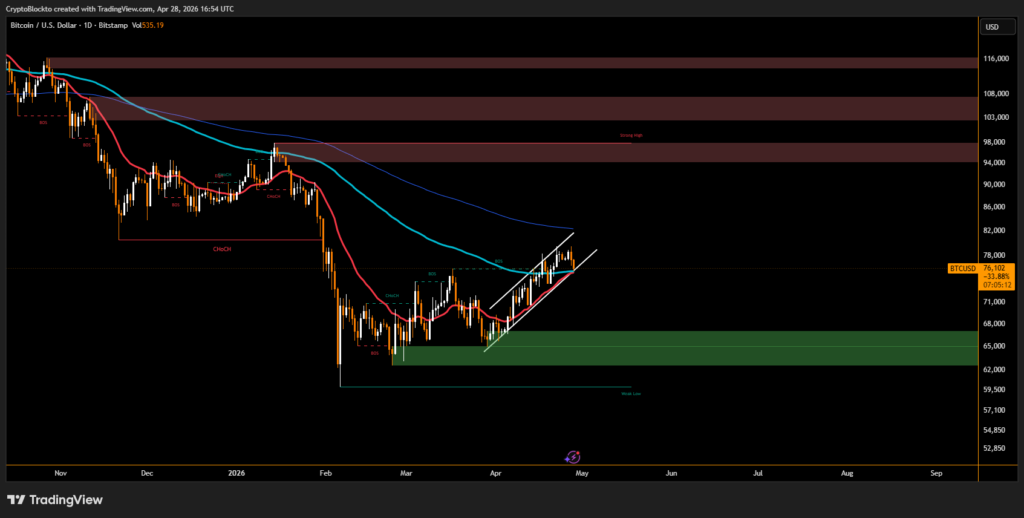
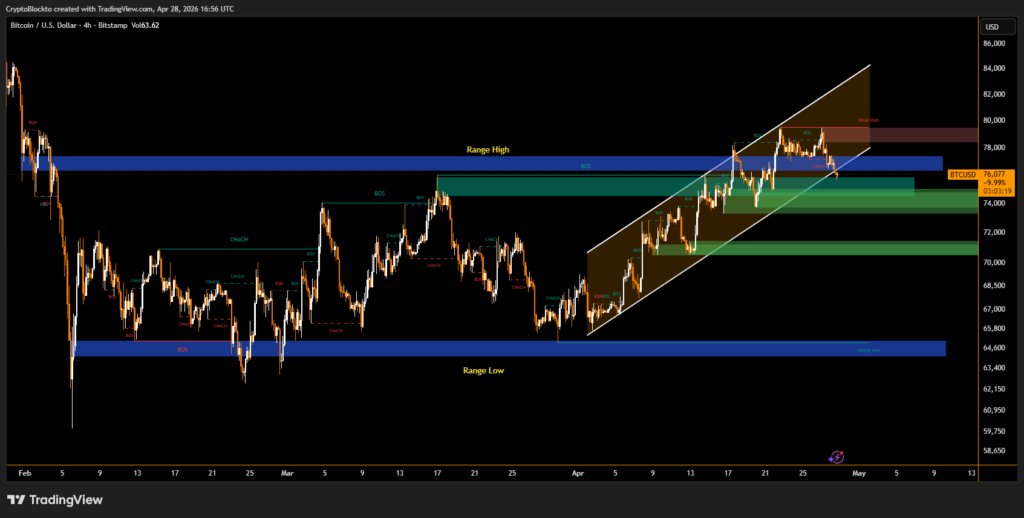
Technical indicators show Bitcoin trading within a tight range, with strong support near $75,500 and heavy resistance around $80,000. The $75,500 level remains significant, as it aligns with multiple moving averages and has historically attracted buyer interest. Meanwhile, resistance near $78,000 reflects a concentration of investor positions acquired at that price, increasing the likelihood of selling pressure.
Onchain Data Shows Rising Buy Pressure but Weak Participation
Onchain metrics present a mixed outlook. Spot cumulative volume delta (CVD), which tracks net buying versus selling activity, surged to $54.8 million from $18.3 million over the past week, indicating stronger buying pressure. However, overall spot trading volume declined by 13.8% to $5.99 billion, suggesting reduced market participation.
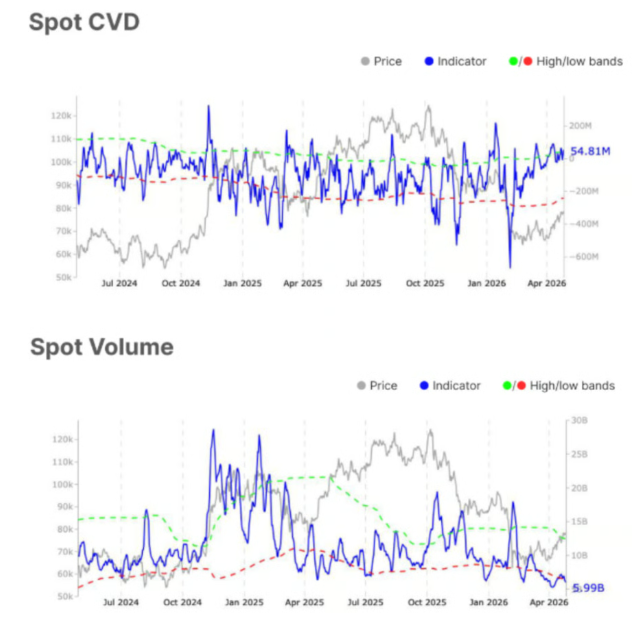
Daily active Bitcoin addresses also fell by about 1.6%, reflecting lower network activity and reduced speculative interest among traders.
Institutional Flows and Key Price Zones Remain Crucial
Institutional demand remains uncertain, with continued corporate purchases offset by $273 million in net outflows from U.S.-based spot Bitcoin exchange-traded funds earlier this week. Analysts note that a decisive move above $80,000 could signal renewed bullish momentum, while failure to hold support near $75,500 may shift attention toward deeper support zones between $65,500 and $67,000.
Live market reaction
Disclaimer
This content is for informational purposes only and does not constitute financial, investment, or legal advice. Cryptocurrency trading involves risk and may result in financial loss.
Start trading
with BloFin today
Up to $500 sign-up bonus and zero-fee trading on your first 30 days.
Buy crypto nowⓘ You will be redirected to BloFin
About the author
Emerging voice in crypto journalism with a background in fintech and digital economics. Covers DeFi, NFTs, and the evolving regulatory landscape.