
Photo: Illustrative
Bitcoin Liquidation Levels Signal $7.9 Billion Short Squeeze Above $70,000
New derivatives data indicates that Bitcoin could trigger significant liquidation cascades if it moves beyond key price thresholds in the near term.
.jpeg)
New derivatives data indicates that Bitcoin could trigger significant liquidation cascades if it moves beyond key price thresholds in the near term.
According to figures compiled by Coinglass, a breakout above $70,000 would expose approximately $7.91 billion in cumulative short liquidation intensity across major centralized exchanges (CEXs). This suggests that a strong upward move could force bearish traders to close leveraged positions, accelerating volatility through a short squeeze.
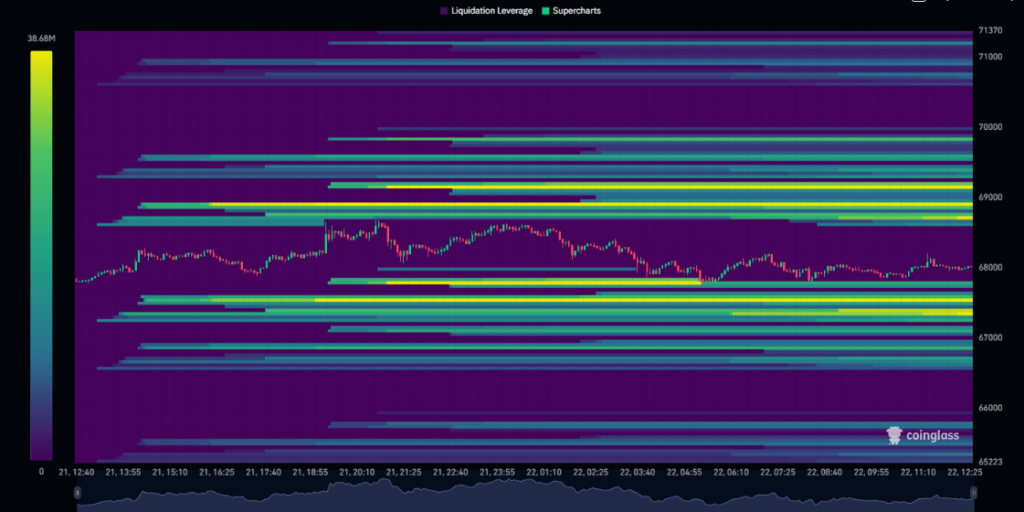
Long Liquidation Risk Builds Below $66,000
On the downside, a decline below $66,000 would put roughly $7.78 billion in cumulative long liquidation intensity at risk. In this scenario, leveraged bullish positions could be forcibly closed, adding further downward pressure to the market.
It is important to note that liquidation heatmaps do not represent the precise dollar value of contracts set to be liquidated. Instead, they illustrate relative intensity highlighting where concentrated leverage may amplify price movements.
Liquidation Clusters and Market Volatility
Taller bars on liquidation charts indicate stronger potential reactions as price reaches those levels. When large clusters are triggered, cascading orders can magnify volatility within a short timeframe.
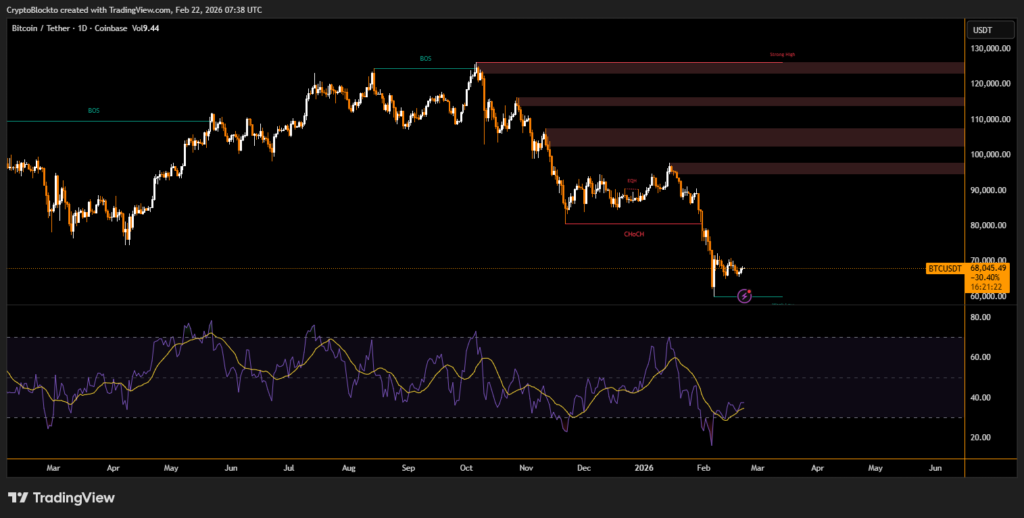
With Bitcoin trading near critical resistance and support zones, derivatives positioning suggests the market remains highly sensitive to breakout or breakdown scenarios in the coming sessions.
Disclaimer
This content is for informational purposes only and does not constitute financial, investment, or legal advice. Cryptocurrency trading involves risk and may result in financial loss.
Live market reaction
Disclaimer
This content is for informational purposes only and does not constitute financial, investment, or legal advice. Cryptocurrency trading involves risk and may result in financial loss.
Start trading
with BloFin today
Up to $500 sign-up bonus and zero-fee trading on your first 30 days.
Buy crypto nowⓘ You will be redirected to BloFin
About the author
Emerging voice in crypto journalism with a background in fintech and digital economics. Covers DeFi, NFTs, and the evolving regulatory landscape.

BitMine Expands Ethereum Holdings With $238M Purchase, Nears 5% Supply Target

Bitcoin Price Outlook: Why BTC Could Move Toward $95K After $80K Recovery

Trump-Linked World Liberty Files Defamation Case Against Justin Sun Over WLFI Token Dispute