
Photo: Illustrative
Bitcoin Price Charts Signal Potential Market Bottom Near $60K
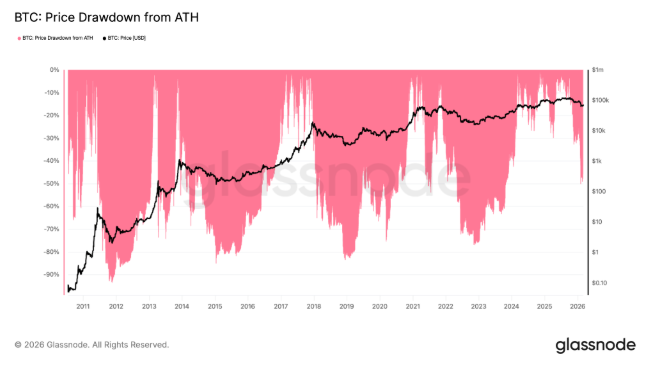
Bitcoin has recently rebounded from a multi year low near $60,000, climbing to around $74,000 before stabilizing close to $70,000. Despite still trading more than 40% below its previous peak of roughly $126,000, several technical indicators suggest the crypto may be forming a market bottom.

Bitcoin has recently rebounded from a multi year low near $60,000, climbing to around $74,000 before stabilizing close to $70,000. Despite still trading more than 40% below its previous peak of roughly $126,000, several technical indicators suggest the crypto may be forming a market bottom.
One key signal is the appearance of a double bottom pattern on shorter term charts. This formation, often interpreted as a bullish reversal signal, indicates that selling pressure may be weakening. The pattern gained further confirmation after Bitcoin moved above the neckline level around $70,000, which analysts often view as a sign that a recovery phase could begin if the price holds above that threshold.
Bitcoin-Gold Ratio and Long-Term Trend Line Support
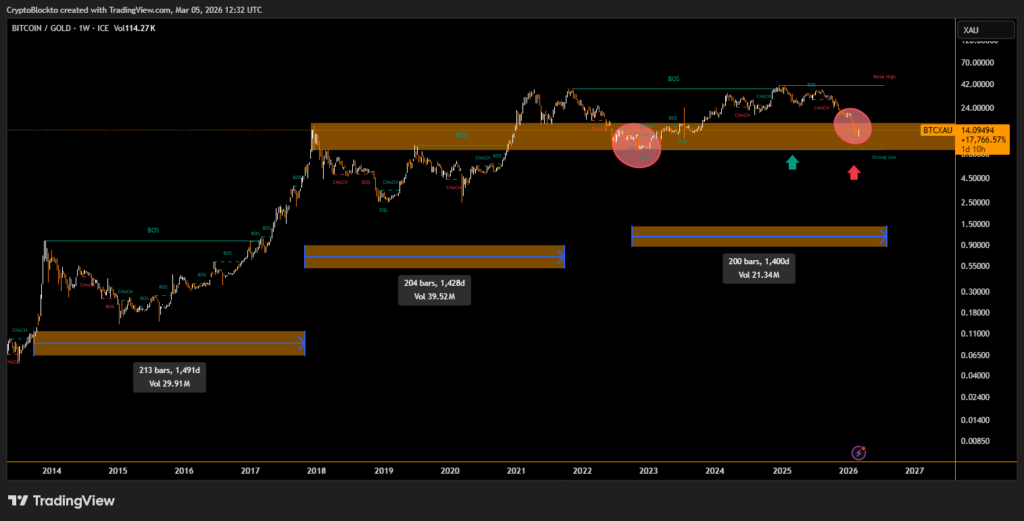
Another indicator attracting attention is the Bitcoin to gold ratio. Historically, when Bitcoin weakens against gold for more than a year, it has often coincided with the later stages of a bear market. The ratio has been trending downward for roughly 13 months, similar to previous cycles that eventually led to strong recoveries.
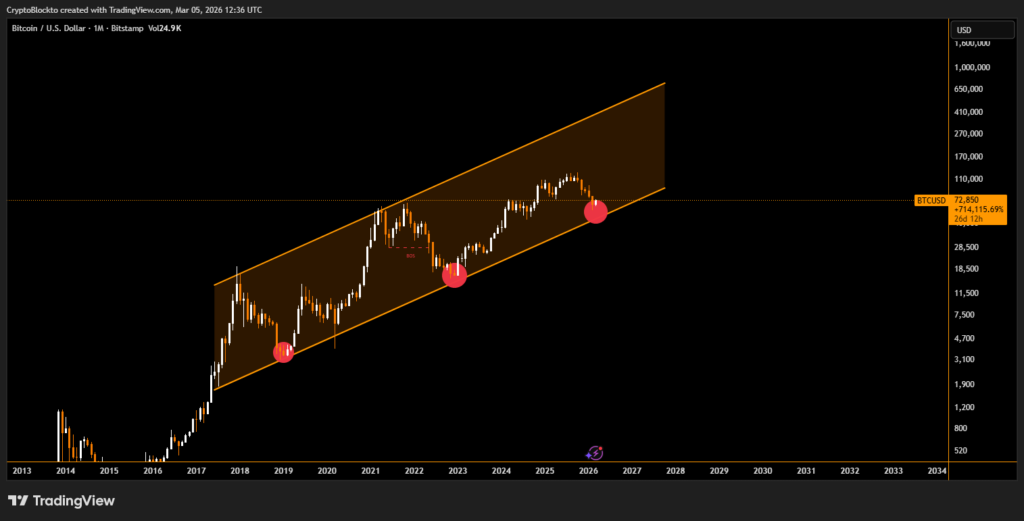
At the same time, Bitcoin is retesting a long-term ascending trend line on higher time frames. In earlier market cycles, similar tests of this support level marked the beginning of significant price rebounds, suggesting the current price range may represent a potential bottom zone.
Disclaimer
This content is for informational purposes only and does not constitute financial, investment, or legal advice. Cryptocurrency trading involves risk and may result in financial loss.
Live market reaction
Disclaimer
This content is for informational purposes only and does not constitute financial, investment, or legal advice. Cryptocurrency trading involves risk and may result in financial loss.
Start trading
with BloFin today
Up to $500 sign-up bonus and zero-fee trading on your first 30 days.
Buy crypto nowⓘ You will be redirected to BloFin
About the author
8+ years covering crypto markets, macro, and geopolitics. Previously at Decrypt and CoinDesk. Focused on the intersection of digital assets and traditional finance.

BitMine Expands Ethereum Holdings With $238M Purchase, Nears 5% Supply Target

Bitcoin Price Outlook: Why BTC Could Move Toward $95K After $80K Recovery

Trump-Linked World Liberty Files Defamation Case Against Justin Sun Over WLFI Token Dispute