Photo: Illustrative
Bitcoin Price Pattern Signals Possible New All-Time Highs as Historical Cycle Repeats
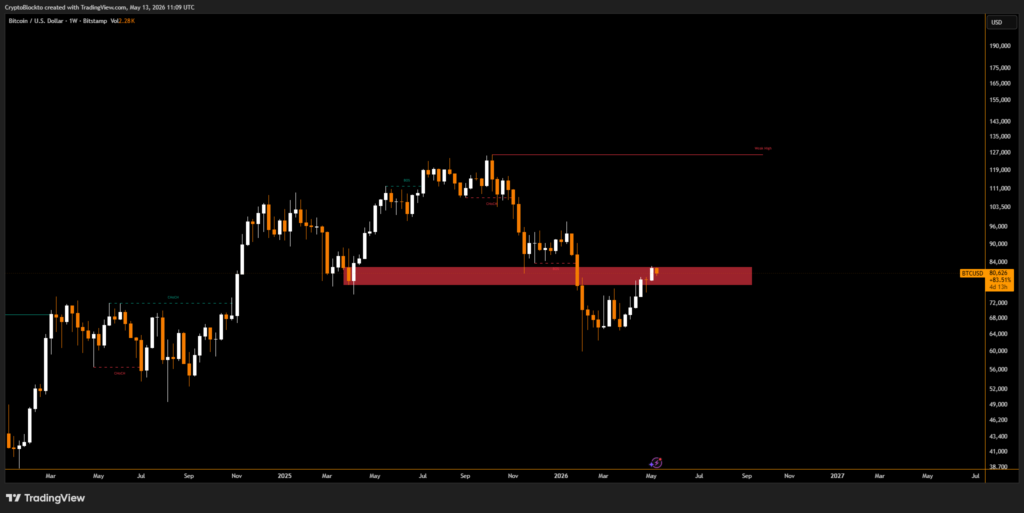
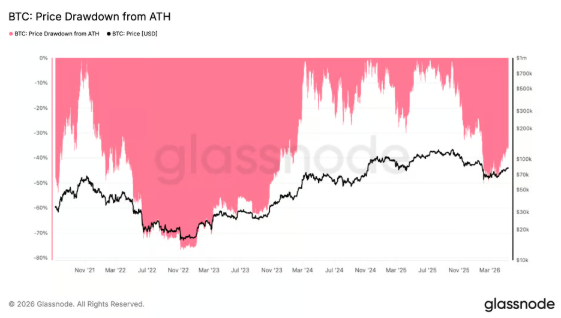
BTC is showing a price pattern that has historically preceded major rallies, according to recent analysis. Btc has reduced its drawdown from its all time high from around 50% to 35%, recovering to nearly $80,000 after previously dipping below $60,000 earlier in the year.

BTC is showing a price pattern that has historically preceded major rallies, according to recent analysis. Btc has reduced its drawdown from its all time high from around 50% to 35%, recovering to nearly $80,000 after previously dipping below $60,000 earlier in the year.
Historical data suggests that similar recoveries have often led to new all-time highs within a short period. Analyst research indicates that in 7 out of 9 past instances, Bitcoin went on to reach a new record price within one year after a comparable recovery phase.
Historical Trends Point to Potential $160,000 Bitcoin Target
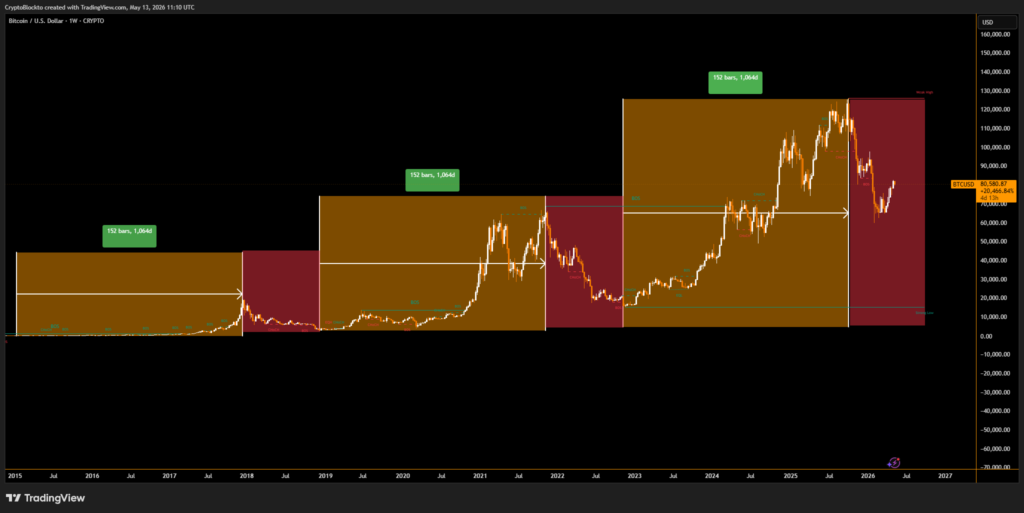
Market history shows that when Bitcoin stabilizes after deep corrections and begins reclaiming lost levels, momentum often builds quickly. The last comparable cycle occurred after the 2022 bear market, when Bitcoin rebounded from a more than 70% decline before setting new highs in 2024.
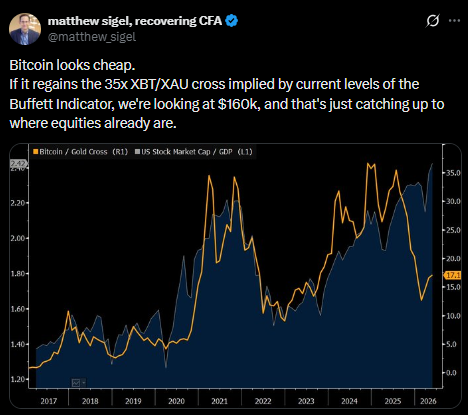
If historical patterns repeat, Bitcoin could move significantly higher over the next cycle, with projections reaching as high as $160,000 per coin based on comparative valuation models against traditional markets.
Macro Indicators and Market Positioning Support Outlook
Bitcoin’s valuation is also being compared to broader financial indicators such as the Buffett indicator, which measures total U.S. stock market value relative to GDP. Analysts argue that relative valuation gaps suggest Bitcoin may still be underpriced compared to equities and gold.
While macroeconomic uncertainty remains, historical cycles indicate that similar recovery structures have often preceded strong upward momentum, keeping long-term bullish expectations in focus.
Live market reaction
Disclaimer
This content is for informational purposes only and does not constitute financial, investment, or legal advice. Cryptocurrency trading involves risk and may result in financial loss.
Start trading
with BloFin today
Up to $500 sign-up bonus and zero-fee trading on your first 30 days.
Buy crypto nowⓘ You will be redirected to BloFin
About the author
8+ years covering crypto markets, macro, and geopolitics. Previously at Decrypt and CoinDesk. Focused on the intersection of digital assets and traditional finance.

Strategy’s Enterprise mNAV Falls Below 1 as MSTR Drops and STRC Hits Record Low of $71.40

Coinbase and OKX Offer Bonuses to Lure Binance’s EU Users After MiCA License Failure

Ripple CEO Brad Garlinghouse Says Saylor’s Strategy Has Hurt Crypto as STRC Hits Record Low