Photo: Illustrative
Bitcoin Price Volatility Returns as US CPI Hits Highest Level Since 2023 on Oil Shock
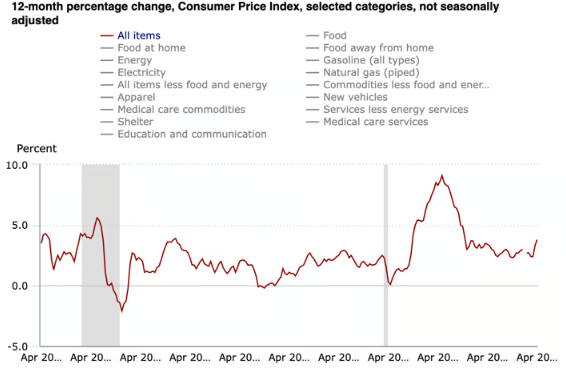
Bitcoin faced renewed volatility as US inflation data showed the CPI rising to 3.8% year on year in April, the highest level since 2023. The increase was largely driven by a sharp rise in energy prices, which jumped nearly 18% over 12 months.
.jpeg)
Bitcoin faced renewed volatility as US inflation data showed the CPI rising to 3.8% year on year in April, the highest level since 2023. The increase was largely driven by a sharp rise in energy prices, which jumped nearly 18% over 12 months.
According to official data, energy costs accounted for more than 40% of the monthly inflation increase. Analysts link the spike to ongoing disruptions in global oil supply following the US-Iran conflict, which has tightened energy markets and pushed crude prices higher.
Bitcoin Trades Near $81,000 as Risk Assets React to Inflation Pressure
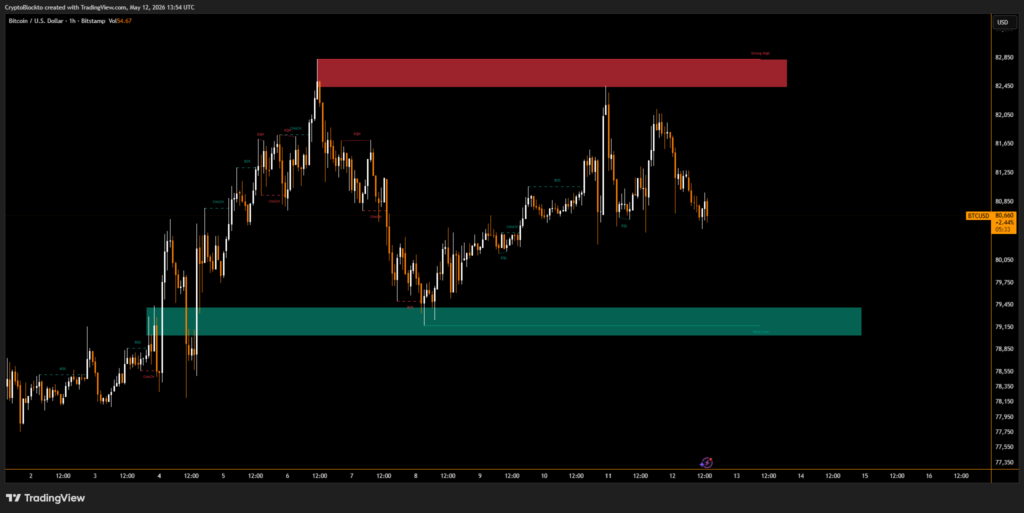
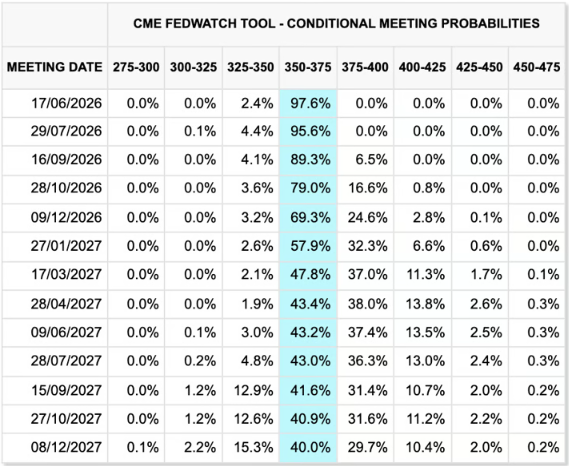
Following the CPI release, Bitcoin hovered around $81,000 as traders weighed inflation risks against potential Federal Reserve policy responses. Market expectations suggest interest rates are likely to remain elevated, with some probability of renewed tightening if inflation persists.
Higher rates typically reduce liquidity in financial markets, which can pressure risk assets like cryptocurrencies.
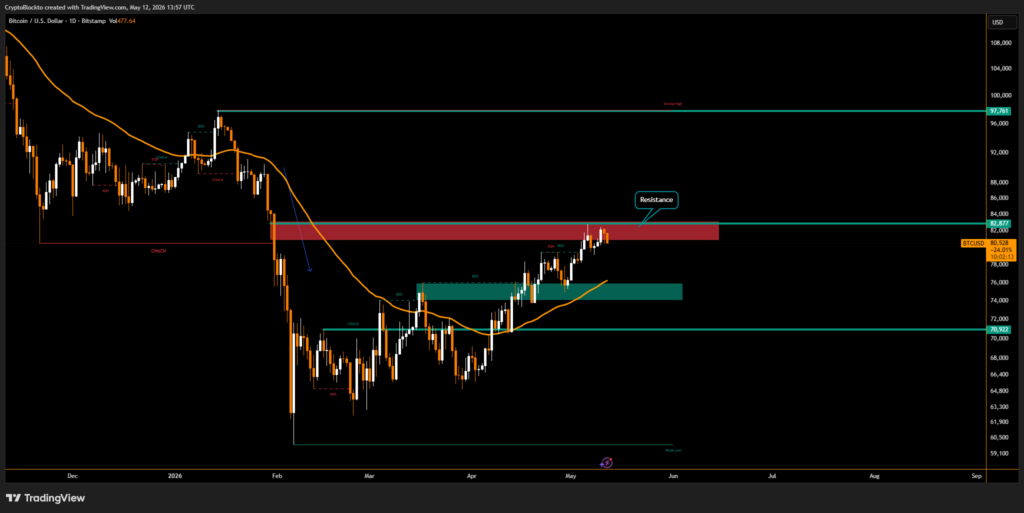
Key Bitcoin Support and Resistance Levels in Focus
Traders are closely watching support near $78,700, while resistance is forming around the 200-day moving average near $82,500. A break below key support zones could signal further downside, while sustained strength may stabilize short-term momentum.
Live market reaction
Disclaimer
This content is for informational purposes only and does not constitute financial, investment, or legal advice. Cryptocurrency trading involves risk and may result in financial loss.
Start trading
with BloFin today
Up to $500 sign-up bonus and zero-fee trading on your first 30 days.
Buy crypto nowⓘ You will be redirected to BloFin
About the author
Emerging voice in crypto journalism with a background in fintech and digital economics. Covers DeFi, NFTs, and the evolving regulatory landscape.