
Photo: Illustrative
Ethereum Faces Downside Risk as Analysts Warn of Possible 20% Drop Toward $1,700
Ethereum is showing signs of weakness after its recent recovery from multi month lows below $1,800. The price failed to break the $2,400 resistance level, and analysts now warn that the market structure is leaning bearish again.

ETH struggles to hold key resistance after recovery
Ethereum is showing signs of weakness after its recent recovery from multi month lows below $1,800. The price failed to break the $2,400 resistance level, and analysts now warn that the market structure is leaning bearish again.
Exchange inflows raise selling pressure concerns
CryptoQuant Data shows a sharp increase in ETH moving onto exchanges, especially Binance, where reserves rose from 3.36 million to 3.84 million between May 5 and May 9. Analysts say this suggests more holders may be preparing to sell.
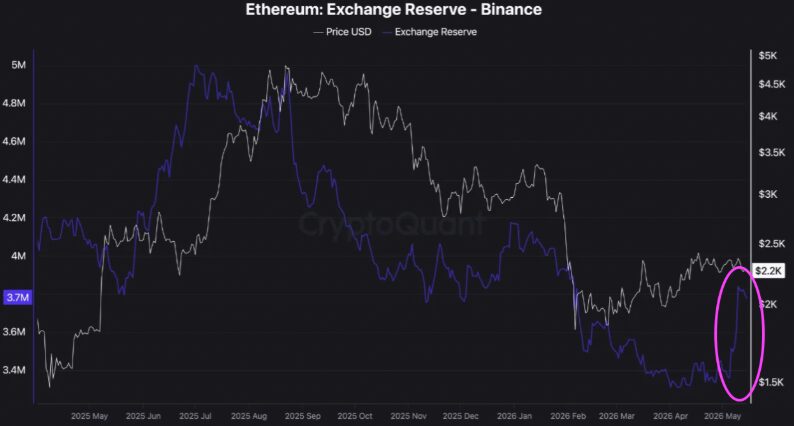
Analysts noted that price action failed to continue upward as inflows increased, dropping from $2,390 to $2,260 during the same period. Liquidity appears to be “absorbed and distributed within the range,” adding that downside risk remains dominant.
Another analyst, PelinayPA, said repeated inflows to exchanges often signal distribution from large holders and create strong resistance for any upward movement.
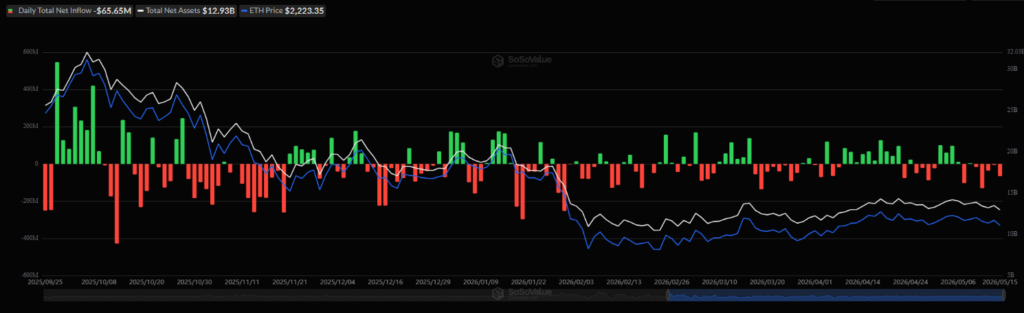
ETF outflows add to bearish pressure
Spot Ethereum ETFs also showed weakness, recording four straight days of outflows totaling around $190 million. Analysts say this points to falling demand from US investors and adds extra pressure on ETH.
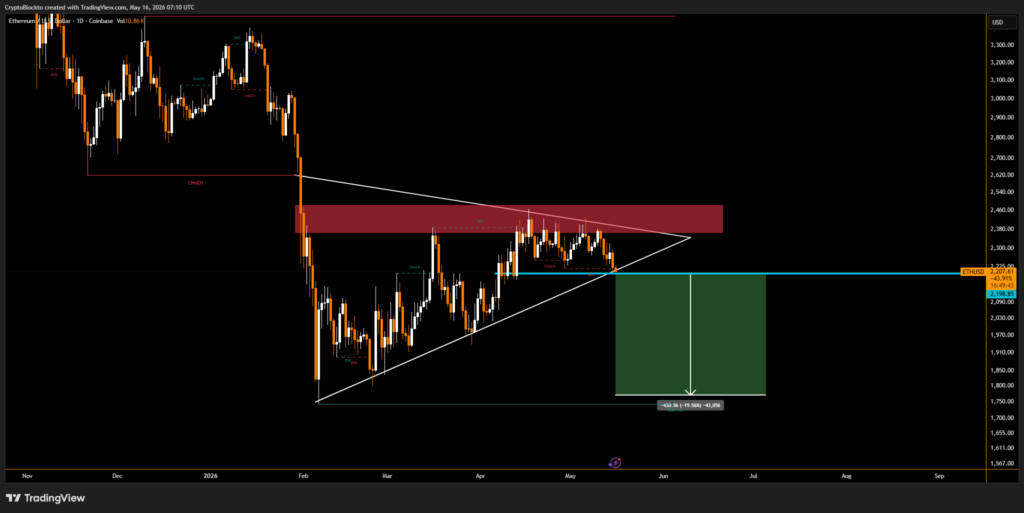
Bearish pattern points to $1,725 target
On the technical side, ETH has broken below a rising wedge pattern after falling under support near $2,280. Analysts say a confirmed close below this level could open the way for a move down toward $1,725, a potential 22% drop from current levels.
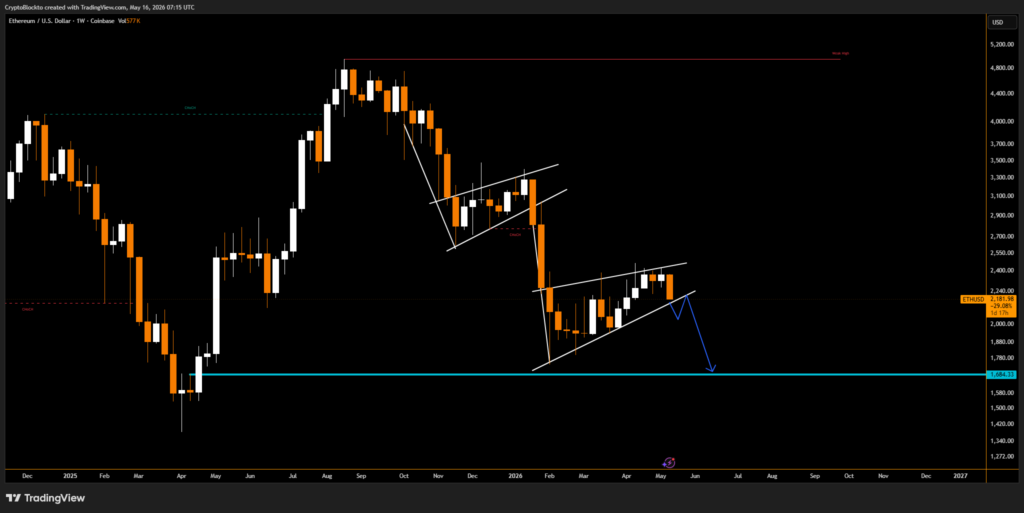
Some analysts also warn that in a deeper bearish scenario, ETH could even slide toward $1,280 based on longer-term chart patterns.
Live market reaction
Disclaimer
This content is for informational purposes only and does not constitute financial, investment, or legal advice. Cryptocurrency trading involves risk and may result in financial loss.
Start trading
with BloFin today
Up to $500 sign-up bonus and zero-fee trading on your first 30 days.
Buy crypto nowⓘ You will be redirected to BloFin
About the author
8+ years covering crypto markets, macro, and geopolitics. Previously at Decrypt and CoinDesk. Focused on the intersection of digital assets and traditional finance.

Germany Pushes for €400 Billion Cut to EU’s Proposed 2028-2034 Budget

Celsius-Linked Bitcoin Miner Ionic Digital Files for Nasdaq Direct Listing as AI Shift Accelerates

Strategy’s Updated Bitcoin Framework Sparks Debate as MSTR and STRC Shares Rally