

DOT/USDT Technical Levels Hint at Potential Turning Point
Polkadot’s recent price action suggests that the market may be entering a decisive phase, with traders closely monitoring structural shifts visible on higher-time-frame charts. A review of the current DOT/USDT daily setup reveals a blend of bearish momentum and potential accumulation signals emerging near major liquidity zones. Analysts say the next few weeks could determine whether the asset stabilizes or continues its downward trajectory.
Major Structural Breaks and Supply Zones
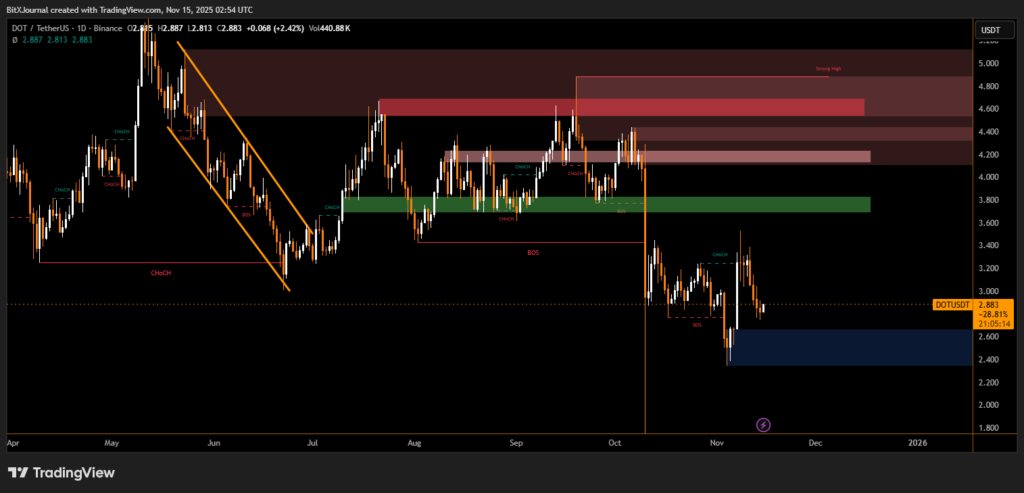
The chart shows a prolonged decline from early summer, where a series of Breaks of Structure (BOS) and Change of Character (ChoCH) events confirmed a persistent downtrend. Above current price levels, several stacked supply zones between $4.20 and $5.00 remain intact. These zones mark areas where strong selling previously entered the market.
<u>These upper supply bands could act as significant resistance should Polkadot attempt a recovery.</u>
BitXJournal technical analyst observing the setup notes, “The clustered supply regions on the daily chart indicate that sellers have defended these levels multiple times. Any bullish relief rally will likely face immediate pressure in these zones.”
Key Demand Zone and Potential Reaction Points
Despite the bearish structure, the chart highlights a deep demand zone around $2.40–$2.60, where buyers historically showed interest. Price has recently dipped into this area, prompting speculation about a potential short-term rebound.
This lower demand pocket is one of the few strong defensive areas left on the chart,” says BitXJournal market strategist. “If buyers cannot maintain support here, the asset risks revisiting levels not seen since early 2023.”
Additionally, a recent ChoCH appearing just above this demand region hints at early signs of a possible shift in momentum, though confirmation remains weak.
With DOT trading near $2.88 at the time of the chart’s capture, traders are watching for either a sustained bounce from the blue demand zone or further breakdowns into untested lower levels. The broader trend remains structurally bearish, but the current range provides a potential staging ground for reversal attempts.
Disclaimer
This content is for informational purposes only and does not constitute financial, investment, or legal advice. Cryptocurrency trading involves risk and may result in financial loss.