

SOL Extends Weekly Decline Despite Bounce Attempt, Market Structure Signals Ongoing Weakness
Solana fell 9% over the past week, continuing a steady retreat from its recent swing highs and slipping closer to a critical higher-timeframe support region. Despite a modest intraday rebound, the broader trend shows sustained pressure on buyers, with technical structure indicating that momentum remains in favor of sellers. The market is now watching whether SOL can stabilize before revisiting deeper demand levels.
SOL Tests Mid-Range Levels After Break of Structure
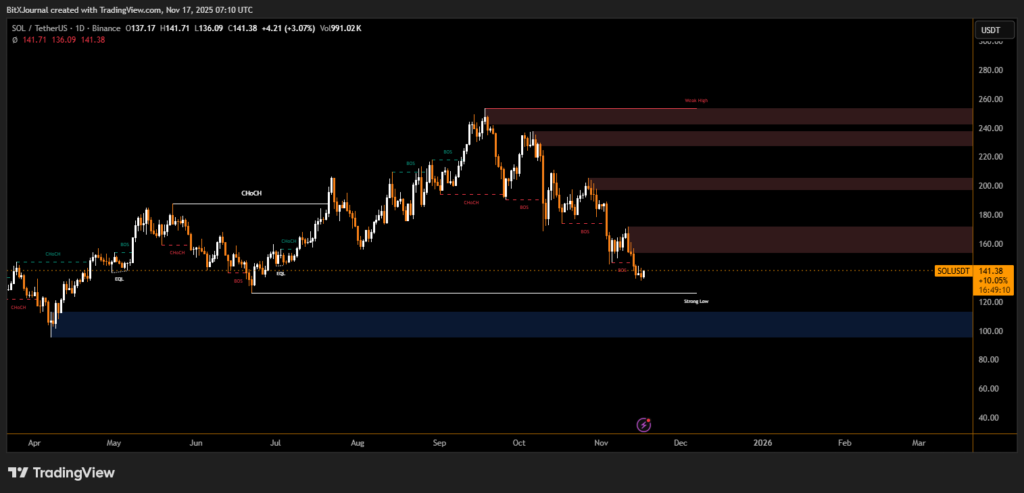
On the daily chart, Solana continues to react within a narrow zone following a series of breaks of structure, which signaled the shift from bullish continuation to controlled distribution. The rejection from the $180–$200 supply region earlier this month set the tone for the current deflation in price.
The chart shows SOL hovering just above a key mid-range level near $136–$142, where previous consolidations held. However, analysts warn that repeated testing without meaningful buyer aggression can weaken the floor.
BitXJournal technical strategist explained, “The market is respecting the lower boundary, but the trend is clearly softening. Until SOL prints a decisive change in character with rising volume, the path of least resistance remains to the downside.”
Broader Market Flows Add to Downward Pressure
The decline aligns with broader weakness in high-beta altcoins, as traders rotate capital defensively following volatility in major assets. Thinning spot demand has left SOL more vulnerable to breakdowns at local support points.
Analysts note that this environment often amplifies technical reactions: strong zones hold when liquidity is present, but neutral periods allow deeper sweeps into demand.
BitXJournal market observer added, “The selloff didn’t come from panic. It’s more of a controlled unwind from the top, especially after liquidity around $160 was taken and failed to convert into continuation.”
Key Zones to Watch
SOL’s immediate test remains the region beneath current price action, hovering above the underlined strong low support around $115–$125. A clean breakdown below this area could expose deeper liquidity pockets that haven’t been tested since early summer.
For bulls, reclaiming $160 is essential. This level represents the midpoint of the recent down-leg and marks the first resistance where continuation patterns previously failed.
Solana’s weekly decline places the asset at a decisive moment. The current structure suggests caution, with traders monitoring whether the key support region will trigger accumulation or open the door to further downside. With momentum leaning bearish and liquidity thinning, market participants expect elevated volatility in the days ahead.
Disclaimer
This content is for informational purposes only and does not constitute financial, investment, or legal advice. Cryptocurrency trading involves risk and may result in financial loss.