

A decisive break of structure below multi-month support has pushed Solana (SOL) into a deeper corrective phase, overshadowing recent optimism around sustained ETF inflows.
Solana retreated to $142 this week after a sharp 5% decline, extending its downward move as the market reacted to a clear technical breakdown visible on the daily chart. Despite healthy trading volume and steady interest from institutional buyers, the token slipped below a level that had acted as support since early autumn. Analysts now describe the pullback as a “structural reset” rather than a routine retracement.
Technical Analysis and Market Context:
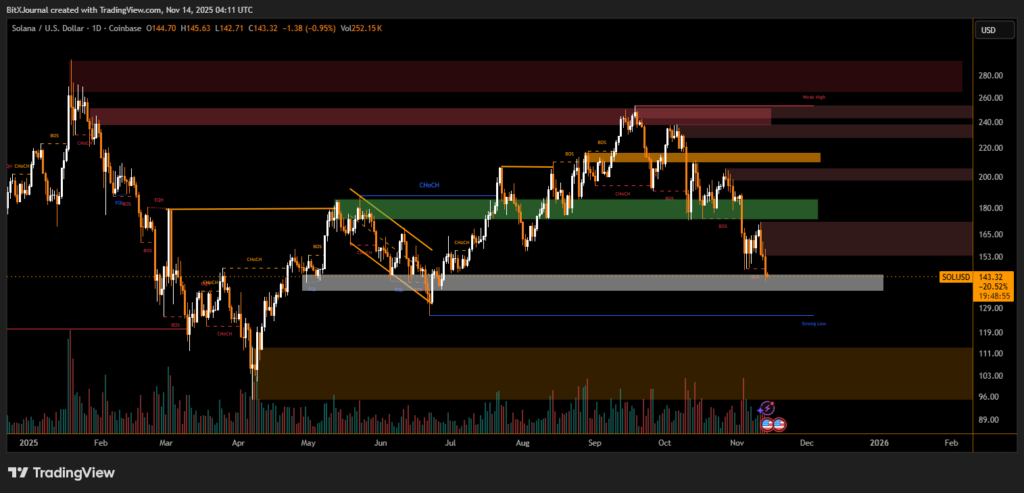
The chart shows Solana falling decisively through the $150–$155 support band, producing a fresh break of structure (BOS) after consecutive lower highs. The move confirms a shift in market momentum toward sellers. The price now sits just above a wide grey demand zone, which previously triggered a mid-year recovery.
BitXJournal technical strategist noted that the latest move “signals a meaningful shift in trend, especially after the clean breakdown from the October–November consolidation range.” He added that the current price reaction suggests the market is testing deeper liquidity pockets before establishing a new directional bias.
The chart highlights multiple change-of-character (CHoCH) zones, showing how buyers consistently lost control throughout October. The failure to reclaim the $165–$175 supply zone further reinforced bearish sentiment. “Until the market retakes that region, upside remains limited,” BitXJournal analysts said.
The broader structure also reveals an unmitigated demand zone near $130, which stands out as a key level where buyers may attempt to reverse short-term downside pressure. Just below that, the chart marks a Strong Low, indicating the last major liquidity point that underpinned Solana’s summer rally.
While ETF inflows remain a supportive fundamental factor, the technical picture signals caution. The path ahead hinges on whether Solana can stabilize within the current demand region and reclaim the $150 mark.
If price fails to hold this area, traders warn of a potential move toward the deeper liquidity block around $120–$130.
The coming days will determine whether this downturn becomes a temporary shakeout or the beginning of a larger market cycle reset.
Disclaimer
This content is for informational purposes only and does not constitute financial, investment, or legal advice. Cryptocurrency trading involves risk and may result in financial loss.