

Support zones and resistance levels shape SUI’s market outlook
SUI has shown a volatile price pattern in recent months, with traders watching closely as it consolidates around a critical support zone. At press time, SUI/USDT was trading near $3.39, down slightly on the day but still up more than 90% year-to-date. Market participants are now evaluating whether the token can defend its short-term floor or risk a deeper correction.
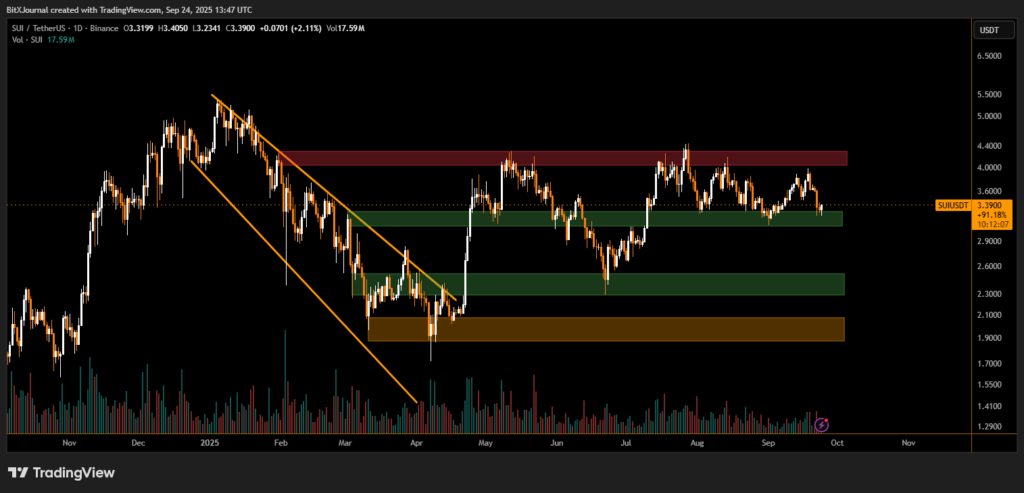
The chart shows that SUI recently retested the $3.2–$3.4 green support zone, which has acted as a pivotal level since July. Below this, the next key demand areas sit around $2.5–$2.7 and further down near $1.9, where buyers previously stepped in during April.
On the upside, the most immediate resistance lies around $4.2–$4.4, highlighted by multiple failed attempts to break higher. “Until bulls can clear this ceiling with strong volume, upside momentum will remain capped,” According to BITX market analysts.
From a broader perspective, SUI broke out of a descending channel in April, signaling the end of a prolonged downtrend. Since then, price action has oscillated between support and resistance ranges, suggesting a market still in search of direction.
Volume analysis indicates that buyers were active during the breakout, but participation has since tapered. “If SUI holds above the $3.2 support, it could set up a move back toward $4,” According to BITX “but a breakdown risks opening the path to $2.7 or even $1.9.”
The coming weeks will be crucial for SUI’s trajectory. Traders are advised to watch how the token reacts at the $3.2 support zone, as holding above it could signal renewed bullish strength, while failure may invite further downside. For now, the battle between support and resistance defines the short-term outlook, with volatility expected to persist.
Disclaimer
This content is for informational purposes only and does not constitute financial, investment, or legal advice. Cryptocurrency trading involves risk and may result in financial loss.