

XRP has declined around 5% against Bitcoin over the past week, with the XRP/BTC pair confirming a bearish descending triangle pattern on the weekly chart. The breakdown occurred after price closed below a key support level near 0.000096 BTC, signaling continued downside risk. Technical projections based on the pattern suggest a potential move toward 0.000011 BTC, representing an estimated 40% decline from current levels.
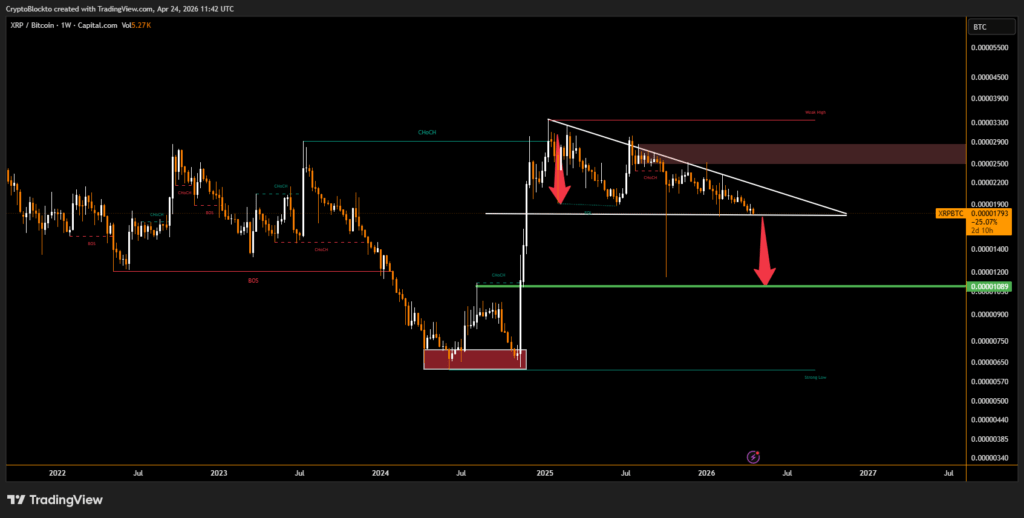
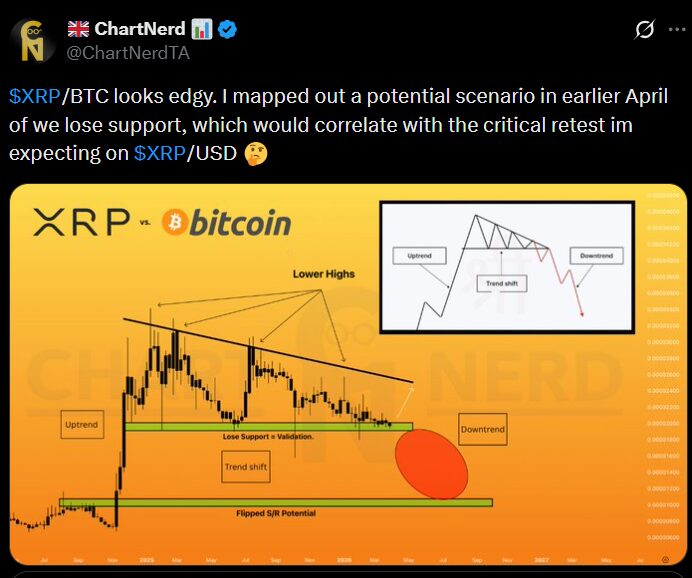
Market analyst ChartNerd noted that losing the 0.000091 BTC support zone could accelerate losses in both the XRP/BTC pair and the XRP/USD market. However, momentum indicators show the relative strength index near 33, an oversold level that has previously aligned with macro bottoms in 2024.
Institutional ETF Inflows Provide Counterbalance to Weak Price Action
Despite technical weakness, institutional demand for XRP continues to build through US spot exchange-traded funds. Data shows nine consecutive days of net inflows, totaling approximately $73.78 million, with cumulative inflows reaching nearly $1.28 billion and assets under management around $1.1 billion.
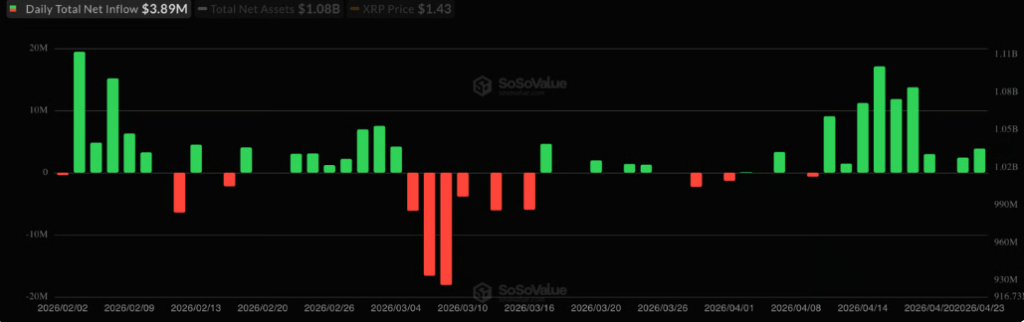
This sustained demand indicates growing institutional accumulation even as XRP has fallen about 22% in 2026 and continues to underperform Bitcoin.
Analysts highlight a tension between bearish chart structure and strengthening ETF inflows. While the descending triangle suggests further downside risk, rising institutional participation is seen as a stabilizing factor that could support a longer-term recovery if buying pressure continues.
Disclaimer
This content is for informational purposes only and does not constitute financial, investment, or legal advice. Cryptocurrency trading involves risk and may result in financial loss.