

XRP has entered a corrective phase after tagging the $2.27 local high, but the broader market structure still leans bullish as long as price holds above the $2.15 demand region highlighted on the chart.
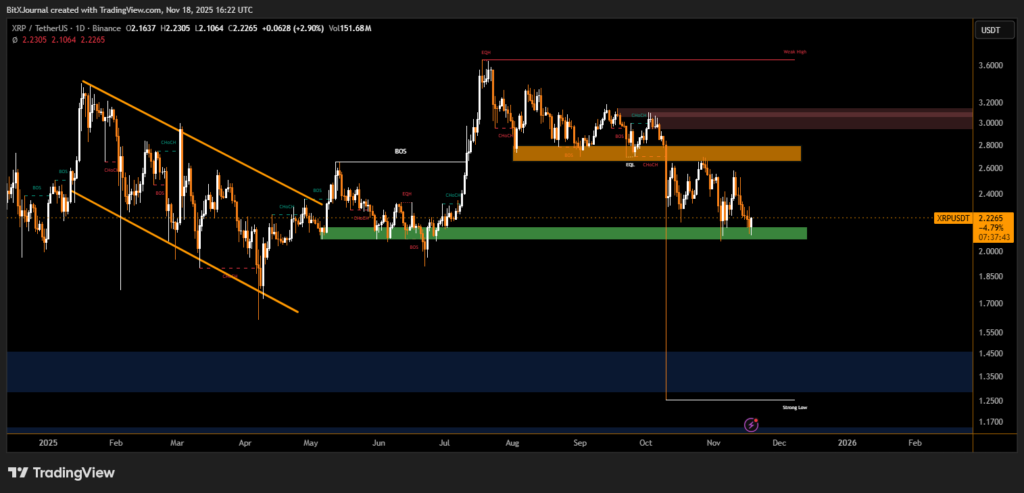
The chart shows XRP retracing into a well-defined green demand zone, which has previously acted as a strong accumulation area. Several historical Change of Character (ChoCH) and Break of Structure (BOS) events occurred around this level, reinforcing its importance as a structural pivot.
As long as price respects this $2.15–$2.18 range, the overall uptrend remains intact. Traders often view this type of retest—following a BOS to the upside—as a healthy pullback within a bullish continuation setup.
What Traders Should Watch
- Holding the $2.15 pivot
Maintaining support above this level could trigger a rebound back into the $2.40–$2.60 region, followed by a potential revisit of the upper $2.80–$3.00 supply zone shown on the chart. - Break below $2.15
A clean breakdown would invalidate the current bullish structure and expose lower liquidity pockets. The next major support sits far below—near the deep demand zone around $1.25–$1.35, marked on the chart as a Strong Low.
Market Context
Despite the recent drop, XRP still trades above several important structural highs, including the mid-July BOS level. Additionally, the chart shows equal highs (EQH) and weak highs higher up on the curve, implying that liquidity above $3.00 remains uncovered—the type of inefficiency markets often revisit in bullish conditions.
XRP’s pullback appears orderly for now, and the uptrend remains intact unless the $2.15 support fails. Traders should pay close attention to reactions within the green demand zone, as this area will likely dictate whether XRP prepares for another leg up or enters a deeper corrective cycle.
Disclaimer
This content is for informational purposes only and does not constitute financial, investment, or legal advice. Cryptocurrency trading involves risk and may result in financial loss.