

Structure breaks and repeated weakness near key supply zones suggest XRP may be preparing for a deeper liquidity sweep before any sustained recovery
XRP’s weekly chart reveals mounting selling pressure as the asset struggles to maintain its recent bullish breakout. After tapping into a critical supply region, price action has begun to reverse, triggering structural shifts that analysts say could signal a broader retracement. The chart highlights multiple change-of-character (ChoCH) markers, breaks of structure (BOS) and several liquidity sweeps that point to potential continuation toward lower demand zones.
XRP Rejected From Multi-Year Supply Zone
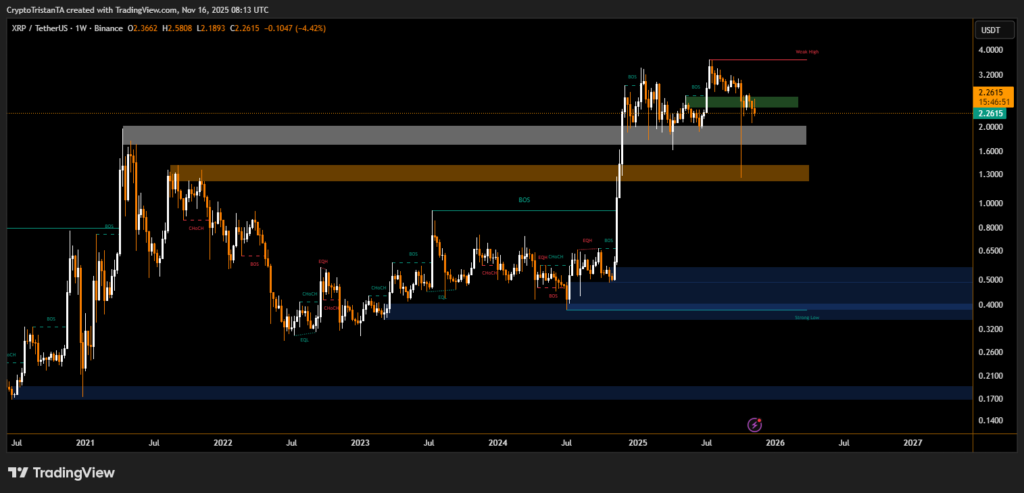
The recent rally pushed XRP into a major supply band around the $2.80–$3.30 region, from which price faced swift rejection. The chart illustrates this zone with overlapping grey and green blocks, capturing historical selling pressure.
According to BitXJournal market technician, “The weekly candles show clear exhaustion near high-timeframe supply, and the presence of multiple weak highs underlines diminishing buyer strength.”
Following the rejection, XRP fell back through short-term structure, slipping beneath the recovery block that previously supported the uptrend. Analysts note that this break confirms a shift in market momentum.
This rejection pattern historically precedes a liquidity hunt into deeper demand blocks.
Key Supports and Liquidity Zones Come Into Focus
The chart marks an extensive demand cluster between $0.40 and $0.60, an area that previously supported the 2024 accumulation phase. Price reacted strongly here during earlier cycles, but analysts warn that continued weakness could lead to a retest.
Another zone—even lower—between $0.17 and $0.25 is highlighted as a long-term strong low. This region represents the deepest liquidity pool on the chart.
One of BitXJournal analyst remarks, “If XRP loses the mid-range support, a move toward the historical demand at sub-$0.30 levels becomes increasingly probable.”
The market structure currently favors sellers unless price reclaims the recent BOS level above $3.00 with conviction.
XRP remains in a vulnerable technical position. Unless buyers defend the mid-range cluster near $2.00, the chart suggests the asset may continue its descent into lower demand zones. Traders are watching for confirmation signals—such as a bullish BOS or a strong weekly close above supply—to assess whether a sustainable reversal is developing.
The coming weeks will determine whether XRP stabilizes or enters a deeper corrective phase driven by liquidity targeting.
Disclaimer
This content is for informational purposes only and does not constitute financial, investment, or legal advice. Cryptocurrency trading involves risk and may result in financial loss.