
Photo: Illustrative
Bitcoin Bottom May Have Formed During February’s $60,000 Selloff, Key Metrics Suggest
Several Bitcoin market indicators are showing signs that the sharp selloff to nearly $60,000 in February may have marked the bottom of the current correction cycle.
.jpeg)
Several Bitcoin market indicators are showing signs that the sharp selloff to nearly $60,000 in February may have marked the bottom of the current correction cycle.
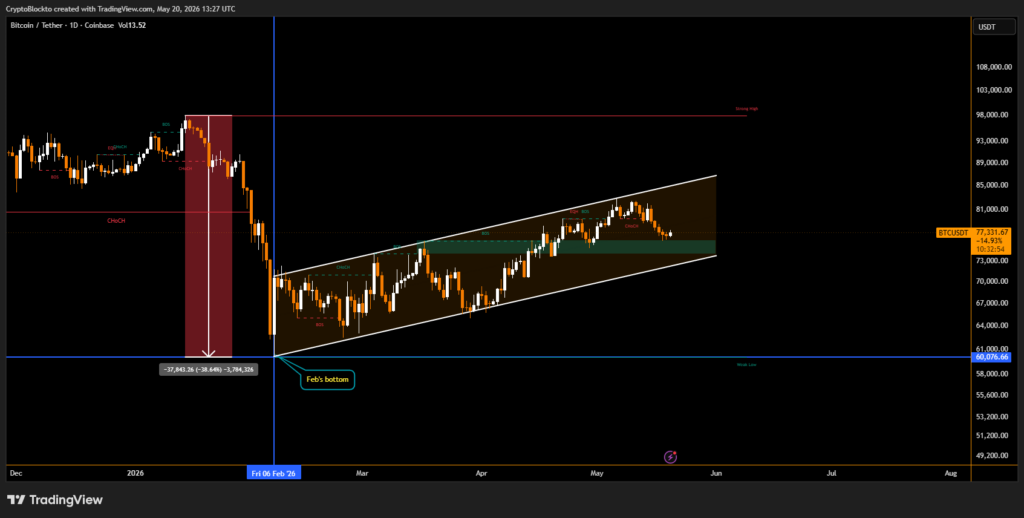
While analysts say no single signal can confirm a market bottom with certainty, a combination of onchain and derivatives data suggests the worst phase of Bitcoin’s decline could already be over. Bitcoin is currently trading back above $77,000 after recovering from heavy losses earlier this year.
Realized Cap Stabilization Signals Possible Recovery
Bitcoin’s realized cap, which measures the total value of Bitcoin based on the price coins last moved onchain rather than the current market price.
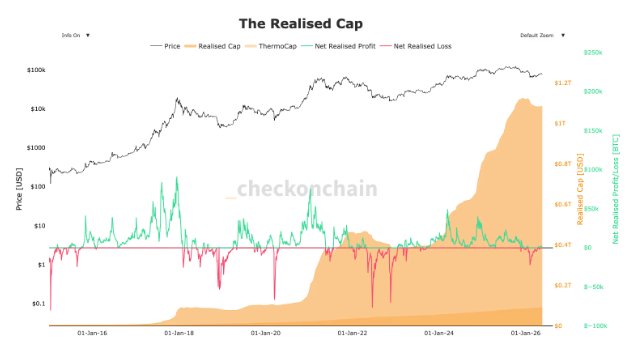
The metric climbed to nearly $1.12 trillion before falling to around $1.08 trillion as Bitcoin dropped more than 50% from its October all-time high. Analysts say this represented one of the largest periods of wealth destruction in Bitcoin history.
However, realized cap has now started stabilizing near $1.08 trillion, forming a pattern similar to previous cycle bottoms seen during the 2022 bear market.
RHODL Ratio Shows Long-Term Holders Staying Strong
Another closely watched signal is the RHODL Ratio, which compares holdings of long-term investors with newer market participants.
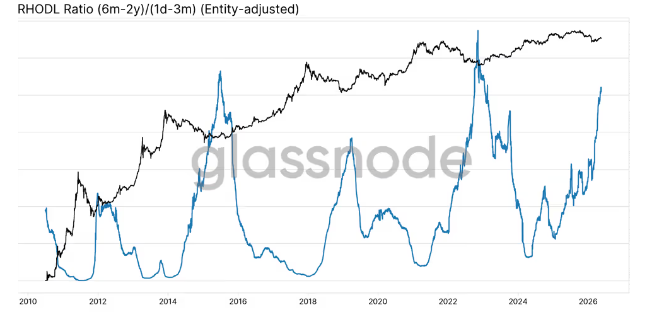
The ratio has climbed above 5, marking the third-highest reading ever recorded. The only higher readings came during Bitcoin bottoms in 2015 and 2022.
Since February, long term holders have added more than 400,000 BTC, suggesting experienced investors are accumulating rather than selling.
Negative Funding Rates Hint at Capitulation
Bitcoin perpetual futures funding rates also stayed deeply negative from February to May, one of the longest stretches on record.
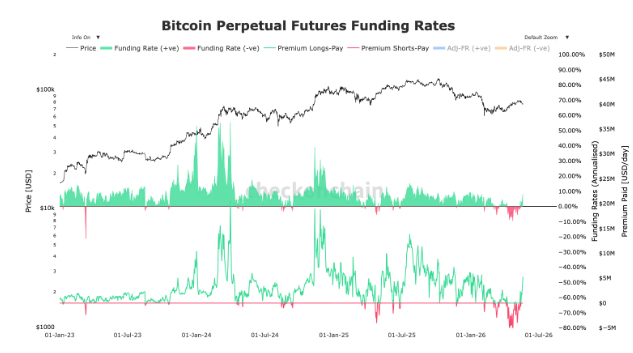
Historically, prolonged negative funding signals heavy bearish sentiment and market exhaustion, conditions often seen near major Bitcoin bottoms. Similar patterns appeared during the 2023 banking crisis, the 2024 yen carry unwind and the tariff-driven selloff in 2025, all of which later became major recovery points for Bitcoin.
Live market reaction
Disclaimer
This content is for informational purposes only and does not constitute financial, investment, or legal advice. Cryptocurrency trading involves risk and may result in financial loss.
Start trading
with BloFin today
Up to $500 sign-up bonus and zero-fee trading on your first 30 days.
Buy crypto nowⓘ You will be redirected to BloFin
About the author
Emerging voice in crypto journalism with a background in fintech and digital economics. Covers DeFi, NFTs, and the evolving regulatory landscape.