
Photo: Illustrative
Bitcoin Climbs After Inflation Data but Analysts Warn of Potential Price Volatility
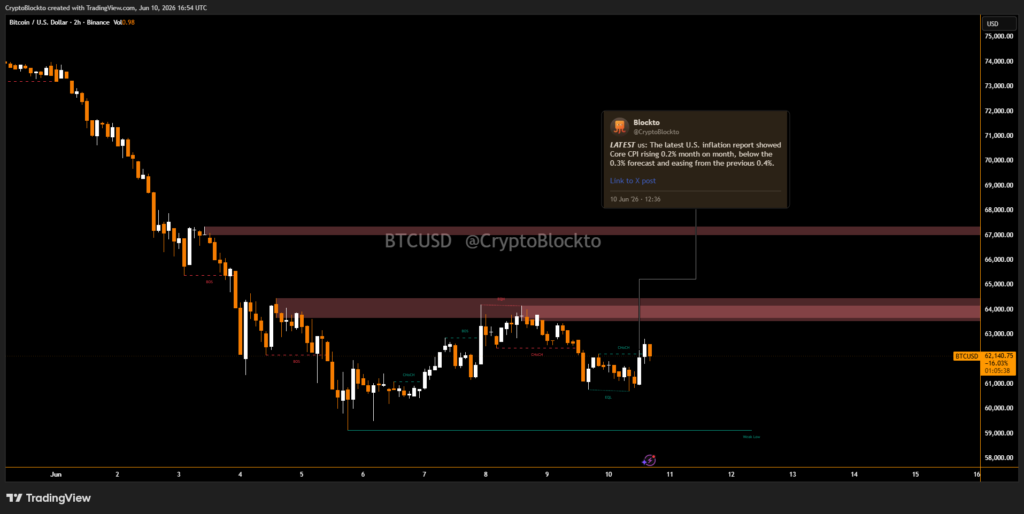
Bitcoin moved higher on June 10 after the latest U.S. inflation report met market expectations, helping ease fears of an even stronger inflation surge. Btc rose about 2.5% to around $62,400 after initially falling following the release of the Consumer Price Index (CPI) data.

Bitcoin moved higher on June 10 after the latest U.S. inflation report met market expectations, helping ease fears of an even stronger inflation surge. Btc rose about 2.5% to around $62,400 after initially falling following the release of the Consumer Price Index (CPI) data.
Bitcoin Gains Despite Inflation Reaching Three-Year High
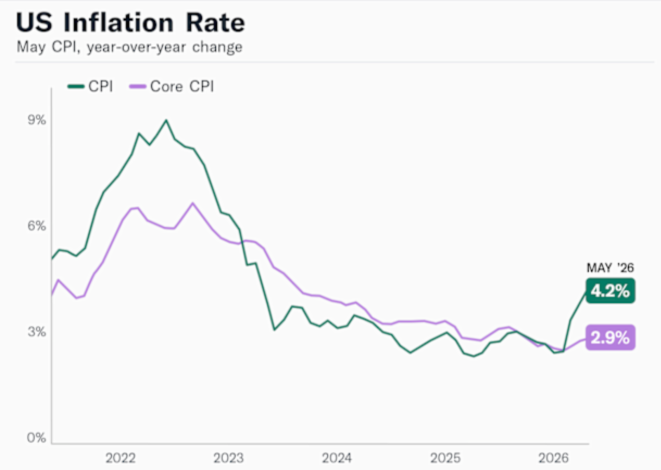
According to the latest figures, U.S. headline inflation increased 4.2% year over year in May, marking its highest level in more than three years. On a monthly basis, inflation rose 0.5%, while core CPI, which excludes food and energy prices, increased 2.9% annually and 0.2% from the previous month.
The rise was largely driven by higher gasoline and energy costs as tensions in the Middle East pushed oil prices higher. Normally, stronger inflation reduces the likelihood of Federal Reserve interest rate cuts, creating pressure on risk assets such as cryptocurrencies.
However, Bitcoin rallied because the inflation figures matched economists’ forecasts. Investors had already expected a 4.2% annual CPI reading, meaning there was no negative surprise that could force the Federal Reserve into a more aggressive policy stance.
Key Support Levels Hold Firm
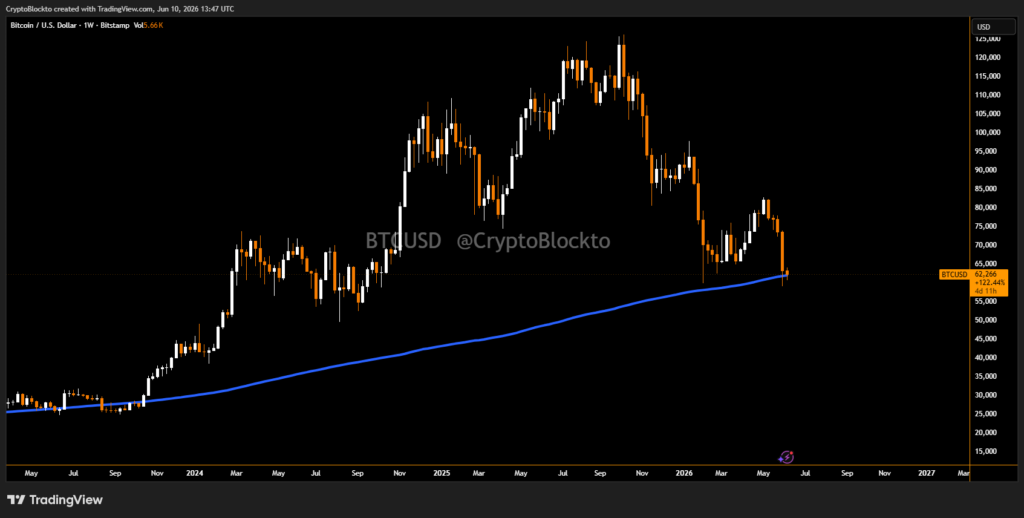
Bitcoin’s rebound was also supported by important technical levels. The cryptocurrency managed to hold above its 200-week Exponential Moving Average (EMA) and remained within the critical $60,000 to $62,000 support zone. These levels have attracted buyers during recent market weakness and helped trigger the latest recovery.
Bitcoin Price Outlook Remains Uncertain
Despite the rebound, analysts caution that Bitcoin has not yet confirmed a bullish trend reversal. The price continues to trade below several important resistance levels, including the 20-period Simple Moving Average (SMA) and the 50-period SMA on the four-hour chart.

Technical analysts also point to a bear flag pattern, a formation that often appears before another downward move. If Bitcoin breaks below the lower boundary of this pattern, the next downside target could be around $57,800, representing a decline of roughly 7.6% from current levels.
For now, traders remain focused on whether Bitcoin can overcome nearby resistance or if inflation concerns and technical weakness will trigger another pullback in the weeks ahead.
Live market reaction
Disclaimer
This content is for informational purposes only and does not constitute financial, investment, or legal advice. Cryptocurrency trading involves risk and may result in financial loss.
Start trading
with BloFin today
Up to $500 sign-up bonus and zero-fee trading on your first 30 days.
Buy crypto nowⓘ You will be redirected to BloFin
About the author
8+ years covering crypto markets, macro, and geopolitics. Previously at Decrypt and CoinDesk. Focused on the intersection of digital assets and traditional finance.