

Photo: Illustrative
Bitcoin Moving Averages Near First Full Bullish Alignment in Over a Year
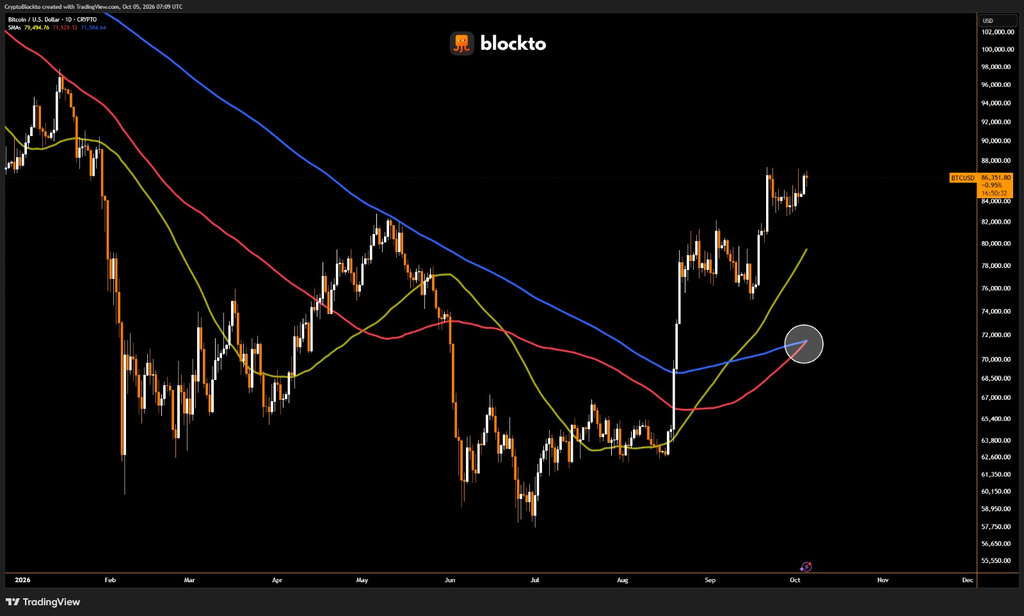
Bitcoin's short, medium and long term trends are close to pointing upward together for the first time since 2025, even though the price slipped today. The 50-day average sits at $79,495, comfortably above the others, while the 100-day at $70,493 is rising and about to pass the 200-day at $70,539. Once that crossover happens, the order of 50-day above 100-day above 200-day will be restored, the first time since the alignment of June 24, 2025..

Bitcoin’s short, medium and long term trends are close to pointing upward together for the first time since 2025, even though the price slipped today. The 50-day average sits at $79,495, comfortably above the others, while the 100-day at $70,493 is rising and about to pass the 200-day at $70,539. Once that crossover happens, the order of 50-day above 100-day above 200-day will be restored, the first time since the alignment of June 24, 2025..
What Moving Average Alignment Means for Bitcoin
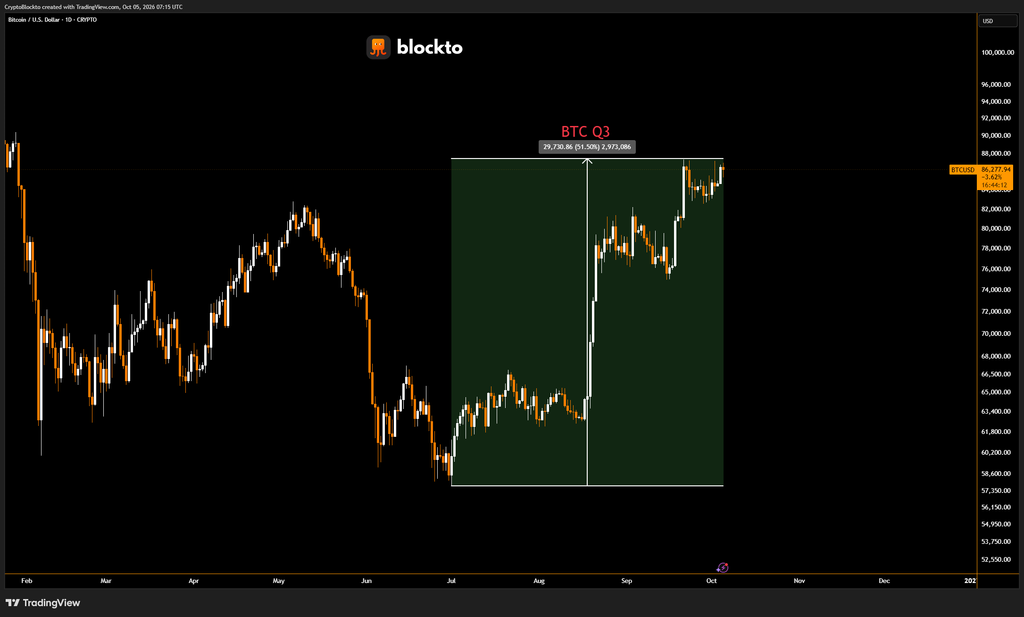
Traders use these averages to read trend direction, and short-term lines sitting above long term ones show recent prices are stronger than older ones. The signal suggests the three month recovery is real, with bitcoin up more than 50% in the third quarter to about $87,000. The climb has recently stalled near $85,000 as the US Dollar Index keeps rising.
Past Bitcoin Bullish Alignments and Results
History is mixed. The setup that formed on Oct. 27, 2020, near $13,600, lasted until May 2021, by which time bitcoin had topped $64,000. The one confirmed in early November 2023 held until May 2024, as the price more than doubled from about $35,000 to $73,000. Other cases paid off less: the June 2025 alignment lasted 97 days and bitcoin moved only from roughly $106,000 to $112,000, while a June 2024 setup lasted 20 days and the price fell about 10%.
Key Bitcoin Support Level to Watch
Coindesk reported, The Giottus chief says the crossover strengthens the trend case but guarantees nothing, and later price action will decide whether it becomes a lasting bull structure or a short lived one. In his view, the bigger test is whether bitcoin can hold the 50-day average during a correction.
Live market reaction
Disclaimer
This content is for informational purposes only and does not constitute financial, investment, or legal advice. Cryptocurrency trading involves risk and may result in financial loss.
Start trading
with BloFin today
Up to $500 sign-up bonus and zero-fee trading on your first 30 days.
Buy crypto nowⓘ You will be redirected to BloFin
About the author
Covers Bitcoin, on-chain data and market structure. Breaks down what the charts and wallet flows are actually saying, without the hype.

Bitcoin Circles $86,000 as S&P 500, Nasdaq Hit Record Highs and Ask Liquidity Caps Upside
 Guylian ·
McDonald’s Sued in Proposed Nationwide Class Action Over AI-Driven Menu Pricing
 Tristan R. ·
French Student Protests Hit Biggest Day Yet as Riot Police Clash With Demonstrators and Bond Yields Stay Elevated
.jpeg&w=32&q=75) Laurisa ·
Laurisa ·