
Photo: Illustrative
Bitcoin Struggles near $77,000 as Inflation Fears and Bond Yields Pressure Market
Bitcoin is trading below the $78,000 level, facing renewed selling pressure after failing to break above a major resistance zone. Btc recently tested overhead resistance near $80,000 but failed to maintain momentum, leading to a fresh pullback.
.jpeg)
Bitcoin is trading below the $78,000 level, facing renewed selling pressure after failing to break above a major resistance zone. Btc recently tested overhead resistance near $80,000 but failed to maintain momentum, leading to a fresh pullback.
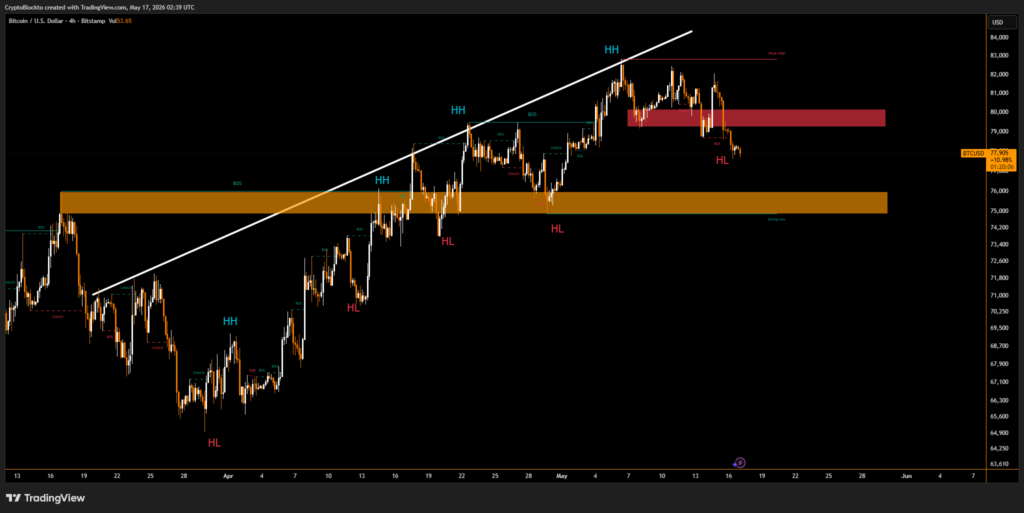
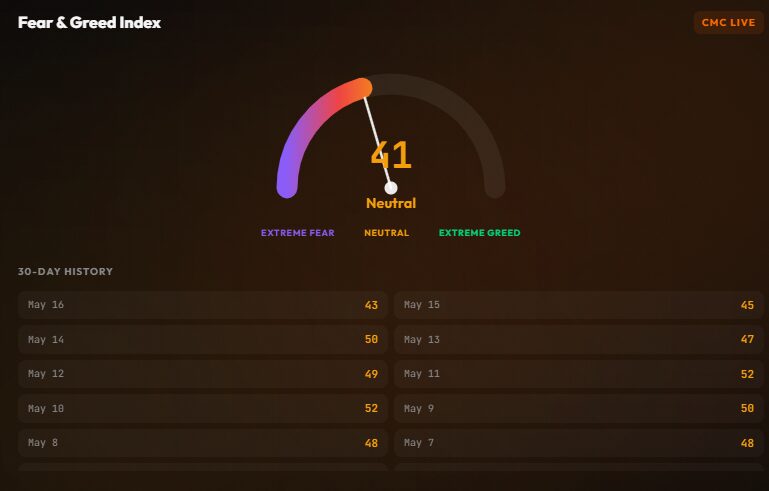
At the time of writing, Bitcoin is trading between $77,800 and $78,200, recording a 24-hour decline of around 1% to 1.5%. Despite the short-term weakness, Bitcoin’s market capitalization remains near $1.56 trillion, while the Fear & Greed Index sits around 41, reflecting a neutral market mood.
Inflation and treasury yields weigh on crypto sentiment
Broader market sentiment has weakened after stronger-than-expected U.S. inflation data revived concerns that interest rates could stay higher for longer. Rising U.S. Treasury yields have also reduced investor appetite for riskier assets, including cryptocurrencies.
These macroeconomic pressures triggered mild liquidations across crypto markets, with traders becoming more cautious amid uncertainty around monetary policy.
Technical indicators show mixed signals for Bitcoin
From a technical perspective, Bitcoin recently faced rejection near its 200-day moving average as Blockto recently reported, an area many traders consider a key long-term trend signal.
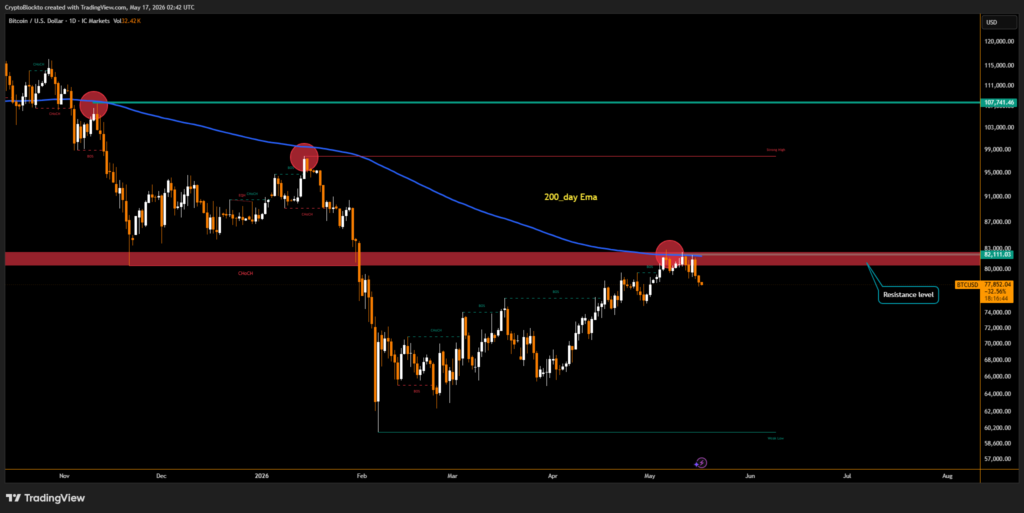
However, some analysts believe current price action may form a possible bear trap, where short-term weakness is followed by a sharp rebound.
Key Bitcoin support and resistance levels to watch
Traders are closely watching support between $75,000 and $71,000, which could act as a buying zone if selling pressure continues. On the upside, reclaiming and holding $80,000 remains important for restoring bullish momentum.
Live market reaction
Disclaimer
This content is for informational purposes only and does not constitute financial, investment, or legal advice. Cryptocurrency trading involves risk and may result in financial loss.
Start trading
with BloFin today
Up to $500 sign-up bonus and zero-fee trading on your first 30 days.
Buy crypto nowⓘ You will be redirected to BloFin
About the author
Emerging voice in crypto journalism with a background in fintech and digital economics. Covers DeFi, NFTs, and the evolving regulatory landscape.

Russia’s Secret China Military Training Approved at Highest Levels, Documents Reveal

Spot Bitcoin ETFs Post Worst Monthly Outflows Since Launch, Shedding $4.5 Billion in June

US Lifts Export Controls on Anthropic’s Fable and Mythos AI Models After Three-Week Ban