
Photo: Illustrative
Bitcoin Technical Signals Suggest Potential Push Toward $80K in April
Bitcoin continued its upward momentum, climbing above $73,000 as traders assess the possibility of a move toward $80,000 before the end of April. The rally gained traction after Bitcoin invalidated a bearish pennant pattern earlier in the week, breaking above the $70,000 trendline and reaching a six-week high near $73,300.

Bitcoin continued its upward momentum, climbing above $73,000 as traders assess the possibility of a move toward $80,000 before the end of April. The rally gained traction after Bitcoin invalidated a bearish pennant pattern earlier in the week, breaking above the $70,000 trendline and reaching a six-week high near $73,300.
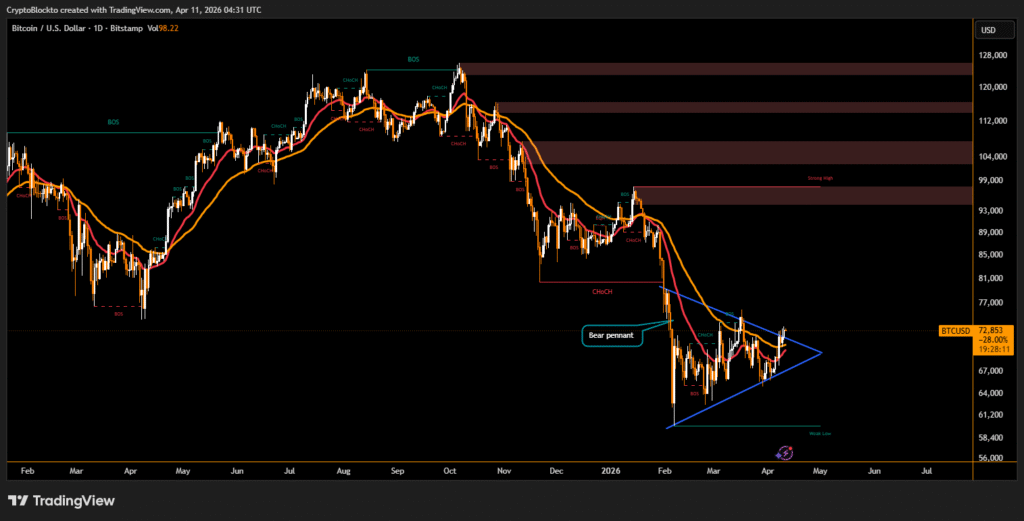
Technical indicators show Bitcoin reclaiming major support levels, including the 200-week, 20-day, and 50-day exponential moving averages around $68,350, $69,520, and $70,580. This recovery increases the likelihood of a symmetrical triangle breakout, a pattern that typically signals continued upward movement. Analysts estimate that the measured breakout from this formation could extend toward $87,000 if momentum remains strong.
Resistance Zones Between $78K and $80K May Limit Gains
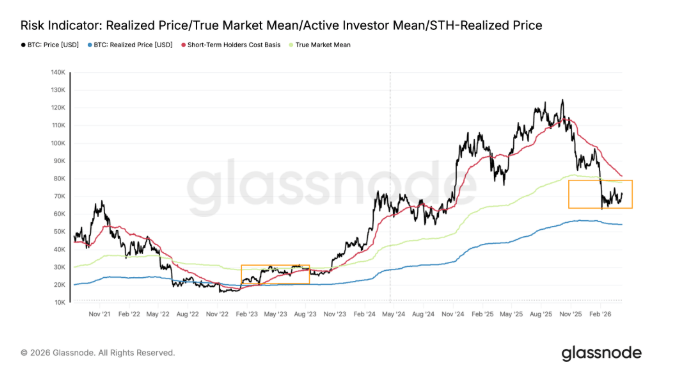
Onchain analytics from Glassnode indicate a strong resistance band between $78,000 and $80,000, aligning with the short-term holder cost basis. This zone is considered critical because investors who bought near these levels may sell to recover earlier losses.
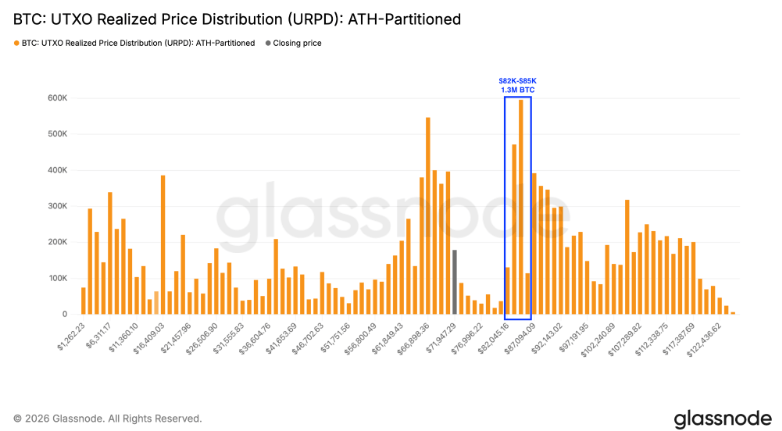
Data also shows Bitcoin entering a relatively open trading zone between $72,000 and $82,000, suggesting that price movement could remain flexible in the near term. However, significant supply exists between $82,000 and $85,000, where more than 1.3 million BTC were accumulated, creating another possible ceiling.
Prediction Market Odds Reflect Growing Bullish Sentiment
Activity on Polymarket shows traders increasingly optimistic about Bitcoin’s April performance. Current market odds suggest a 26% probability that Bitcoin reaches $80,000 this month, while expectations for a $75,000 target remain much stronger at 76%.
At the same time, declining odds for a drop to $65,000 indicate that traders are gradually reducing bearish expectations, reflecting improving sentiment across the digital asset market.
Disclaimer
This content is for informational purposes only and does not constitute financial, investment, or legal advice. Cryptocurrency trading involves risk and may result in financial loss.
Live market reaction
Disclaimer
This content is for informational purposes only and does not constitute financial, investment, or legal advice. Cryptocurrency trading involves risk and may result in financial loss.
Start trading
with BloFin today
Up to $500 sign-up bonus and zero-fee trading on your first 30 days.
Buy crypto nowⓘ You will be redirected to BloFin
About the author
8+ years covering crypto markets, macro, and geopolitics. Previously at Decrypt and CoinDesk. Focused on the intersection of digital assets and traditional finance.