
Photo: Illustrative
Strategy Stock Rallies 25% Outpacing Bitcoin as Traders Eye Potential Market Bottom Signal
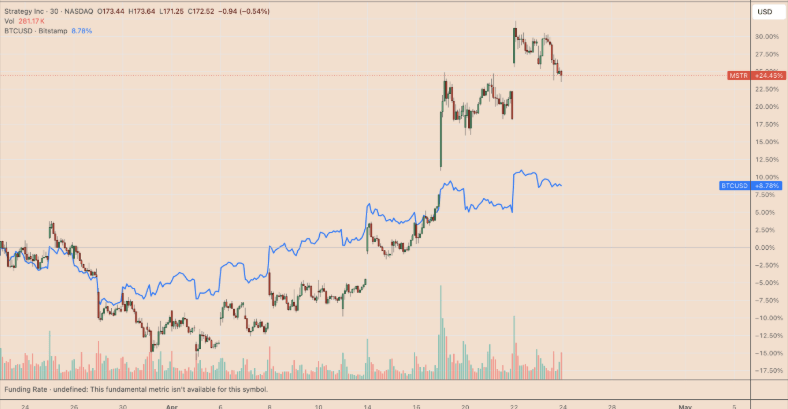
Strategy stock, traded as MSTR, has climbed about 25% over the past month, outperforming Bitcoin which gained roughly 9% in the same period. Market analysts say this relative strength has historically been associated with late-cycle or potential market bottom phases, when traders begin taking higher-risk positions.
.jpeg)
MSTR Outperforms Bitcoin Amid Rising Risk Appetite
Strategy stock, traded as MSTR, has climbed about 25% over the past month, outperforming Bitcoin which gained roughly 9% in the same period. Market analysts say this relative strength has historically been associated with late-cycle or potential market bottom phases, when traders begin taking higher-risk positions.
Historically, MSTR has acted as a leveraged proxy for Bitcoin due to its large BTC holdings. During the 2022–2024 cycle, MSTR surged around 4,000% compared to Bitcoin’s 550% gain, showing amplified upside during bullish recoveries. This outperformance signals that investors may be shifting from defensive positioning into higher-risk, higher-reward assets tied to crypto exposure.
MSTR/BTC Ratio Strength and Technical Breakout Setup
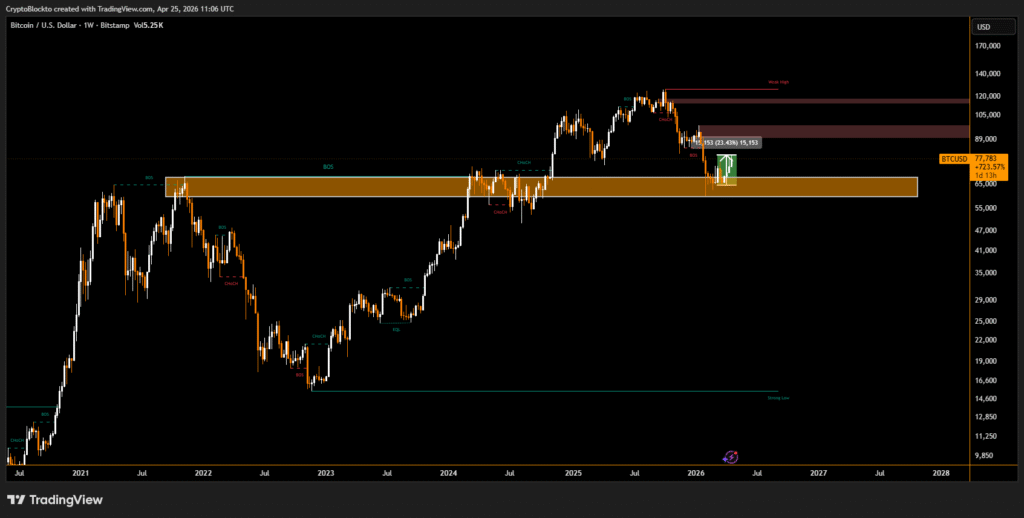
The MSTR/BTC ratio has increased about 30% since January 2026 after forming a local bottom, even as Bitcoin fell nearly 39% in the same period. Analysts view this divergence as a possible early signal of a recovery phase, similar to patterns observed before Bitcoin’s 2022 cycle bottom.
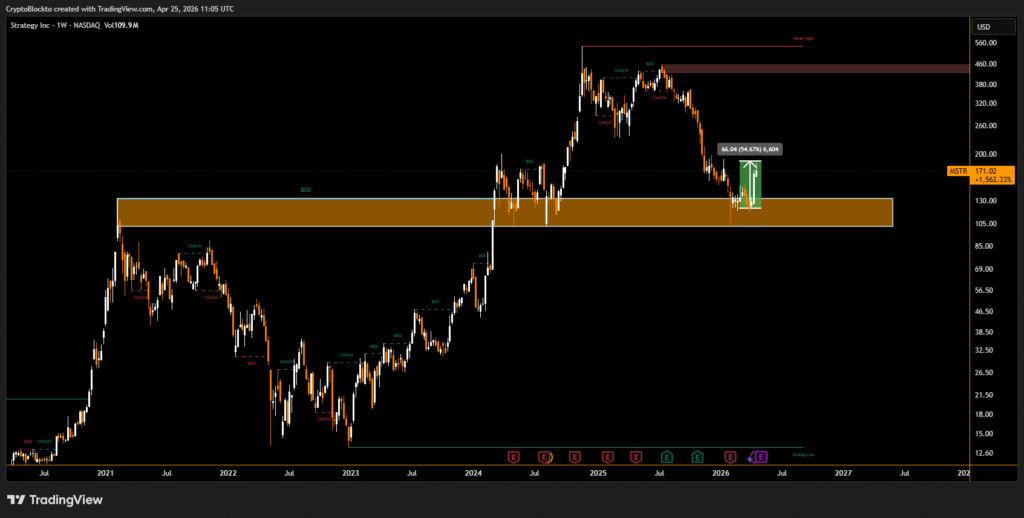
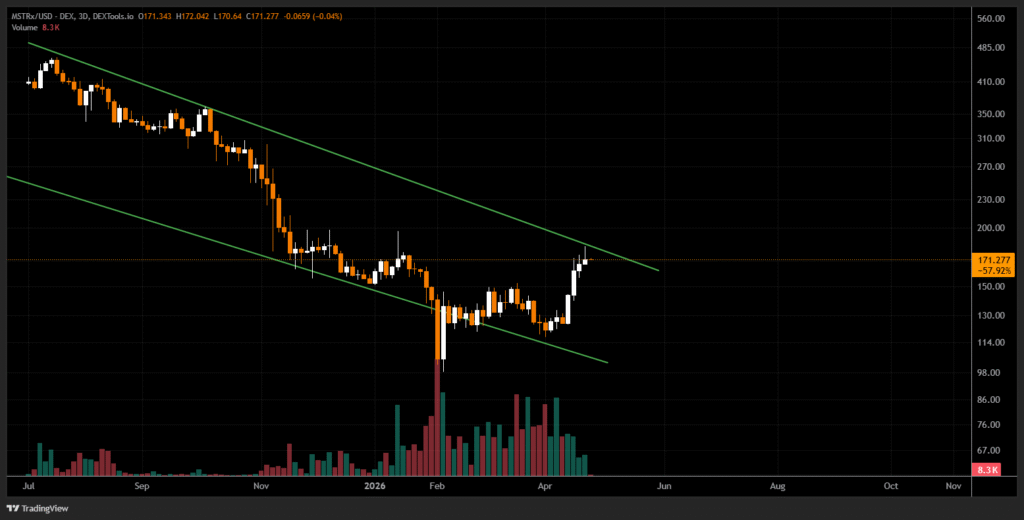
Technically, MSTR is forming an ascending triangle pattern on the 3-day chart, with rising support levels and resistance near the $180–$200 range. A confirmed breakout above this zone could drive the stock toward $260, representing roughly 50% upside, with extended targets near $269 and $320 if momentum continues. However, a breakdown below the $120 support level would invalidate the bullish structure and weaken the current bottoming thesis.
Disclaimer
This content is for informational purposes only and does not constitute financial, investment, or legal advice. Cryptocurrency trading involves risk and may result in financial loss.
Live market reaction
Disclaimer
This content is for informational purposes only and does not constitute financial, investment, or legal advice. Cryptocurrency trading involves risk and may result in financial loss.
Start trading
with BloFin today
Up to $500 sign-up bonus and zero-fee trading on your first 30 days.
Buy crypto nowⓘ You will be redirected to BloFin
About the author
Emerging voice in crypto journalism with a background in fintech and digital economics. Covers DeFi, NFTs, and the evolving regulatory landscape.