Photo: Illustrative
Bitcoin Price Above $82K Resistance as Analysts Warn of Macro Rejection Risk
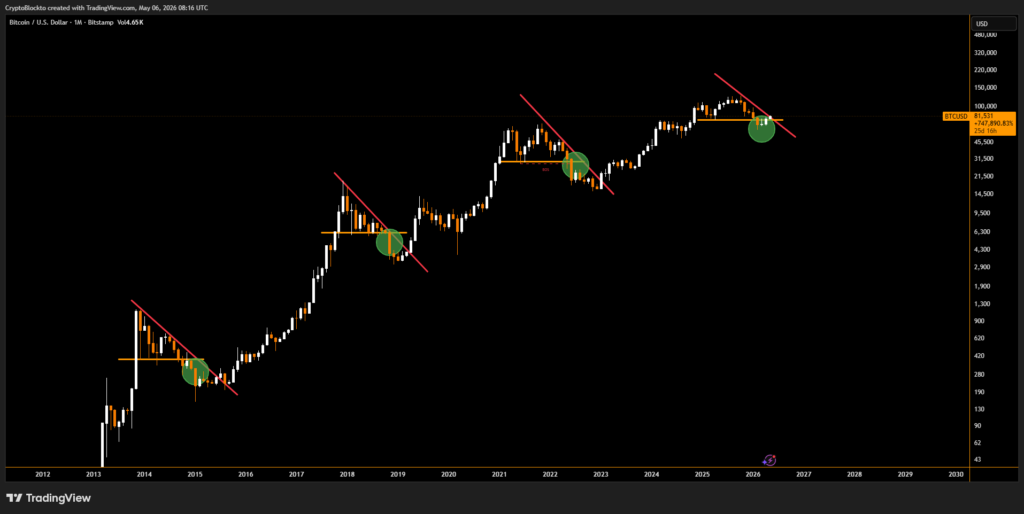
Bitcoin climbed above $82,000 on May 6, reaching around $82,400 during early Wall Street trading and marking its highest level in roughly 13 weeks. The move places BTC at a critical resistance zone, with traders identifying the low $80,000 range as a decisive level that could determine the next major trend.
.jpeg)
Bitcoin climbed above $82,000 on May 6, reaching around $82,400 during early Wall Street trading and marking its highest level in roughly 13 weeks. The move places BTC at a critical resistance zone, with traders identifying the low $80,000 range as a decisive level that could determine the next major trend.
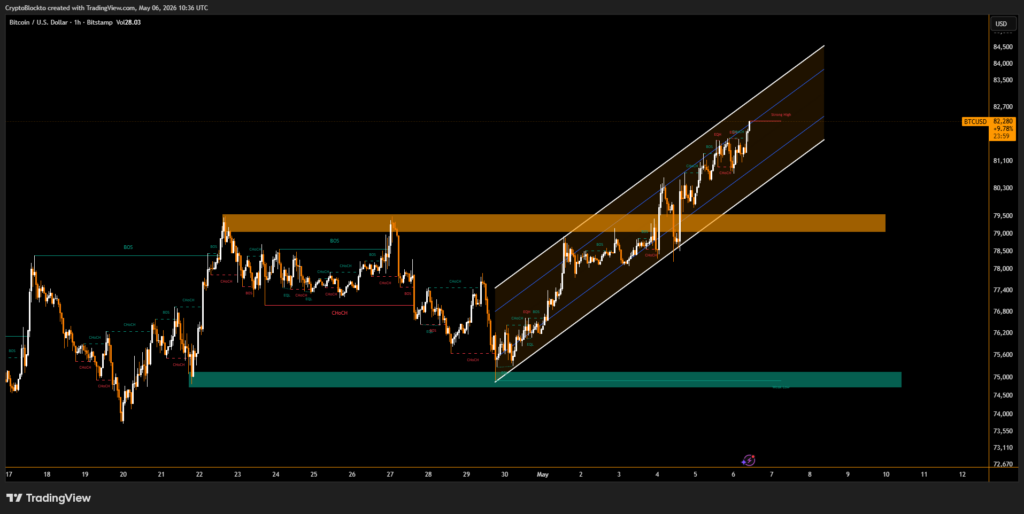
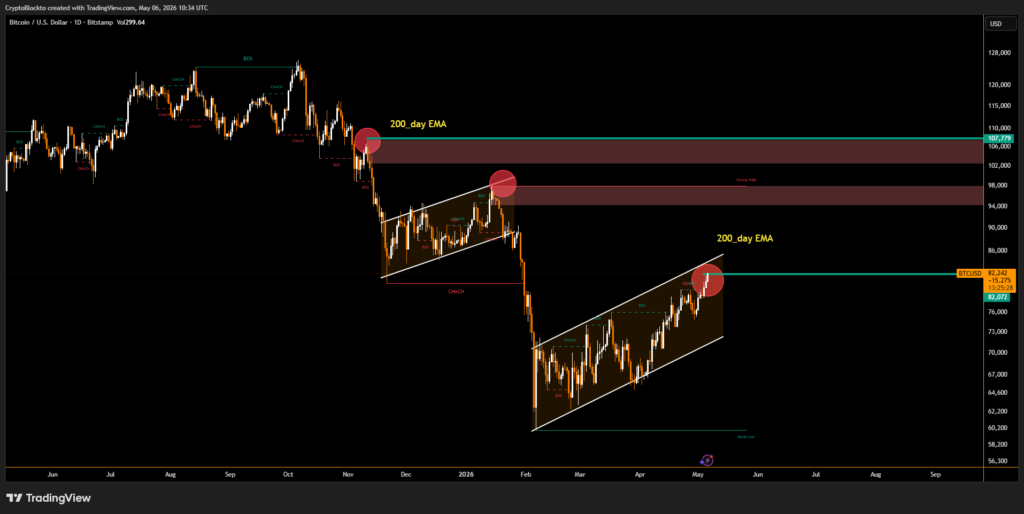
Region aligns with previous support levels from November as well as key moving averages, including the 200-day trend indicators. A sustained break above this range could open the path toward $90,000, while failure to hold may reinforce $80,000 as a near-term ceiling.
Macro Conditions and Market Volatility Impact Sentiment
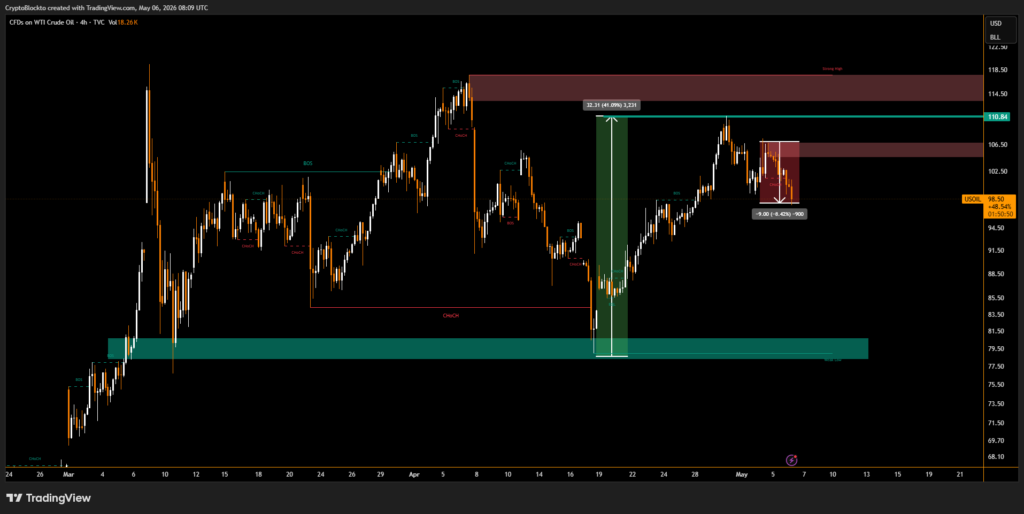
Broader financial markets showed mixed signals, with US equities stabilizing after geopolitical tensions tied to Middle East developments briefly pressured risk assets. Oil prices also pulled back, with WTI crude declining nearly 3% after recent gains.
Some traders argue Bitcoin remains within a broader distribution phase linked to macro resistance levels established during the 2022 market peak. This suggests the mid-term trend could still tilt downward despite short-term gains.
Historical Cycles Raise Doubts About Sustained Uptrend
Skepticism persists among analysts who compare current price action to January’s failed breakout, which preceded a drop below $60,000. Others point to Bitcoin’s historical cycle behavior, arguing that a rapid transition into a new bull phase would break long-standing patterns.
If rejected at current levels, Bitcoin may remain rangebound, while a confirmed breakout would challenge expectations of a prolonged bear cycle.
Live market reaction
Disclaimer
This content is for informational purposes only and does not constitute financial, investment, or legal advice. Cryptocurrency trading involves risk and may result in financial loss.
Start trading
with BloFin today
Up to $500 sign-up bonus and zero-fee trading on your first 30 days.
Buy crypto nowⓘ You will be redirected to BloFin
About the author
Emerging voice in crypto journalism with a background in fintech and digital economics. Covers DeFi, NFTs, and the evolving regulatory landscape.