


Photo: Illustrative
Bitcoin Price Risks Deeper Drop as “Sell in May” Pattern Signals Weak Summer Outlook
Bitcoin is heading toward a negative May close, with prices falling roughly 10% after failing to break resistance near $83,000. The move has revived the well-known market saying “sell in May and go away,” a seasonal pattern often linked to weaker summer performance in risk assets.
.jpeg)
Bitcoin is heading toward a negative May close, with prices falling roughly 10% after failing to break resistance near $83,000. The move has revived the well-known market saying “sell in May and go away,” a seasonal pattern often linked to weaker summer performance in risk assets.
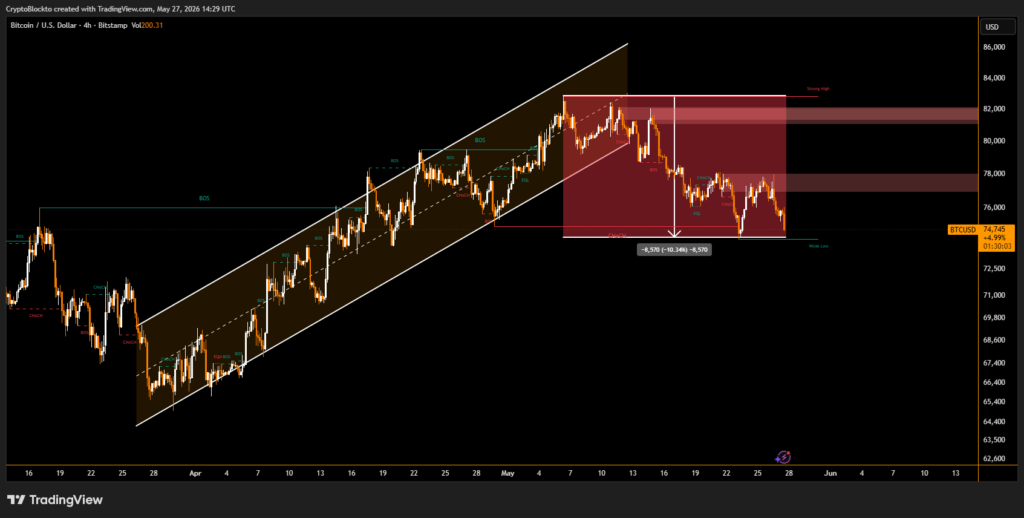
BTC is currently trading near $75,850, and historical data shows that similar red Mays have often led to short term weakness.
Historical Data Shows Weak Post-May Performance
Bitcoin has posted losses in May during 2013, 2015, 2018, 2021, 2022 and 2023. On average, BTC returns one month after a red May have been around -10.1%, with three-month returns averaging about -3.3%.
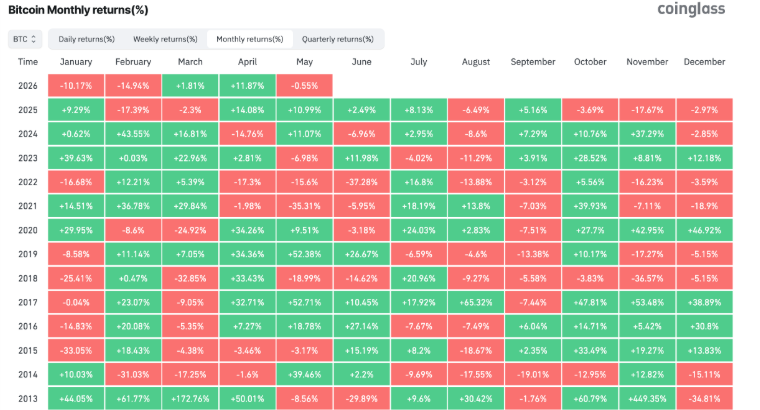
However, longer term data shows mixed outcomes. Six months after a red May, Bitcoin has averaged strong gains, though results are heavily influenced by past outliers. Without extreme years, returns are closer to +12.9%.
Bear Market Risk Still Depends on Key Levels
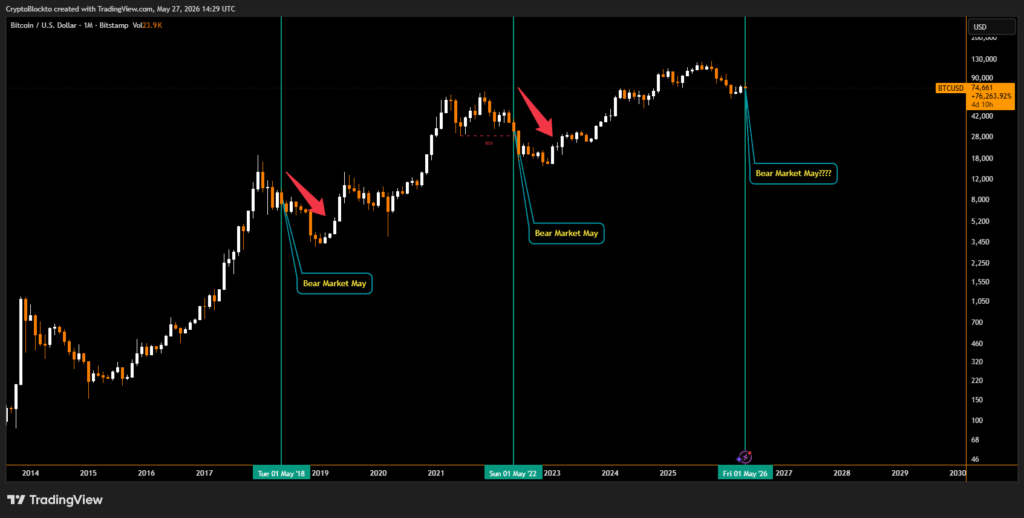
Analysts note that in deeper bear cycles like 2018 and 2022, red Mays preceded sharper declines of over 20% in the following months. For now, Bitcoin remains above key cycle support near $60,000, meaning the broader trend is still uncertain.
Live market reaction
Disclaimer
This content is for informational purposes only and does not constitute financial, investment, or legal advice. Cryptocurrency trading involves risk and may result in financial loss.
Start trading
with BloFin today
Up to $500 sign-up bonus and zero-fee trading on your first 30 days.
Buy crypto nowⓘ You will be redirected to BloFin
About the author
Emerging voice in crypto journalism with a background in fintech and digital economics. Covers DeFi, NFTs, and the evolving regulatory landscape.

Iran Threatens To Abandon US Deal Amid Ongoing Strait Of Hormuz Clashes
.jpeg&w=32&q=75) Laurisa ·
Laurisa · 
Bonzo Finance Loses $9 Million In Hedera Oracle Price Manipulation Attack
Laurisa · 
Bitcoin Treasury Firm Empery Digital Cuts Its BTC Holdings In Half To Fund AI Data Center Push
 Tristan R. ·