
Photo: Illustrative
Bitcoin Rebounds After $600 Million Long Liquidations, But Bearish Risks Remain
Bitcoin staged a strong recovery after falling close to the $60,000 level, a move that triggered heavy liquidations across the crypto market. Btc dropped to around $61,300 before bouncing more than 5.5% to trade near $63,690.
.jpeg)
Bitcoin staged a strong recovery after falling close to the $60,000 level, a move that triggered heavy liquidations across the crypto market. Btc dropped to around $61,300 before bouncing more than 5.5% to trade near $63,690.
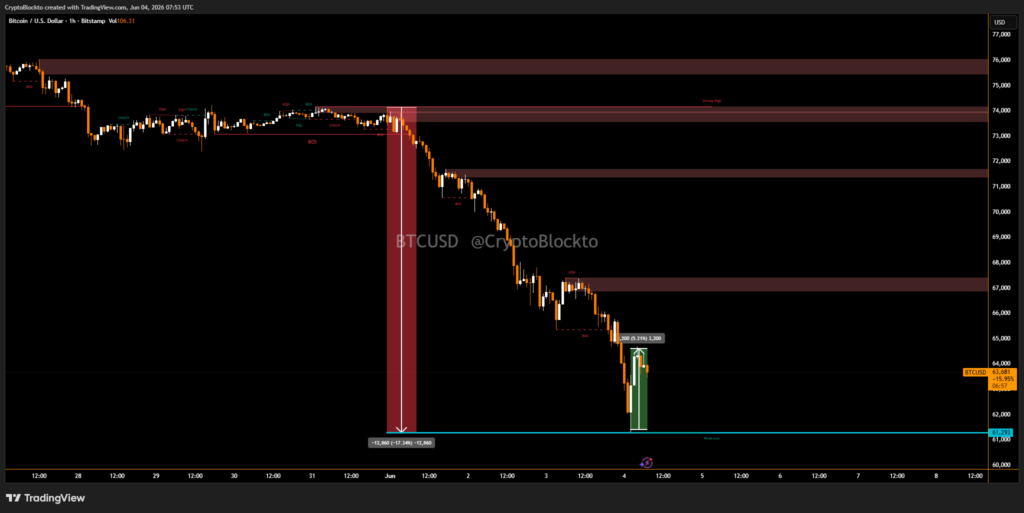
The recovery came as market sentiment improved following reports that Israel and Lebanon had agreed to implement a ceasefire. The sudden rebound encouraged traders who believe the recent sell off may have cleared excessive leverage from the market.
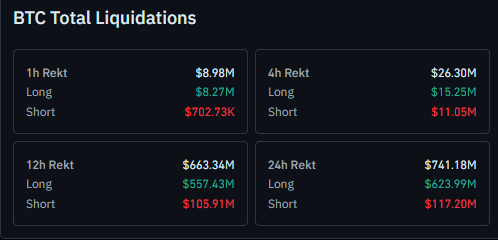
According to CoinGlass data, more than $737 million in Bitcoin positions were wiped out over a 24-hour period. Long traders suffered the biggest losses, with over $617 million in bullish positions liquidated as prices fell sharply.
Traders Eye Potential Move Toward $70,000
Bitcoin could see a short term relief rally toward the $69,000-$70,000 range after the liquidation driven decline.
Bitcoin Bear Flag Pattern Keeps Pressure on Market
Despite the rebound, Bitcoin’s weekly chart continues to show a bear flag breakdown. Analysts say this technical pattern keeps the possibility of a decline toward the $50,000-$52,000 region on the table.
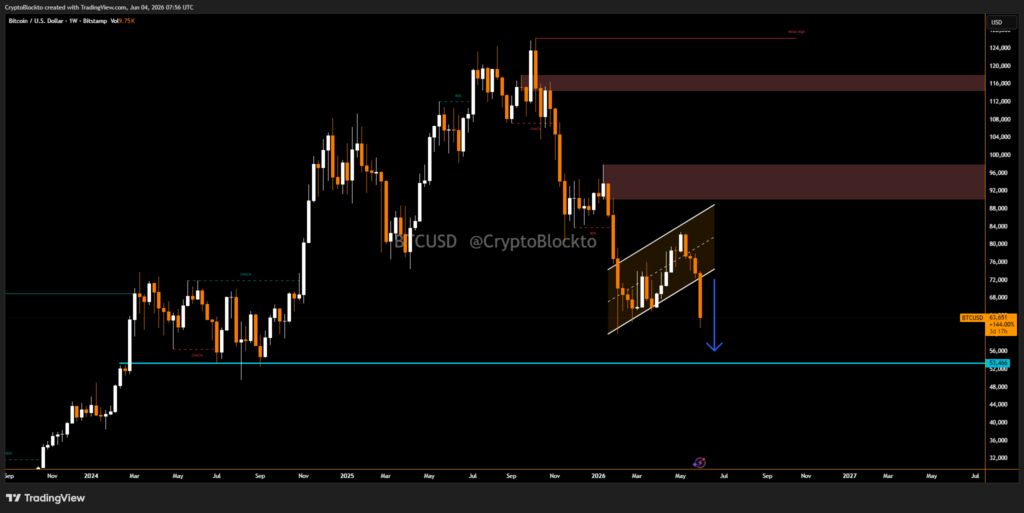
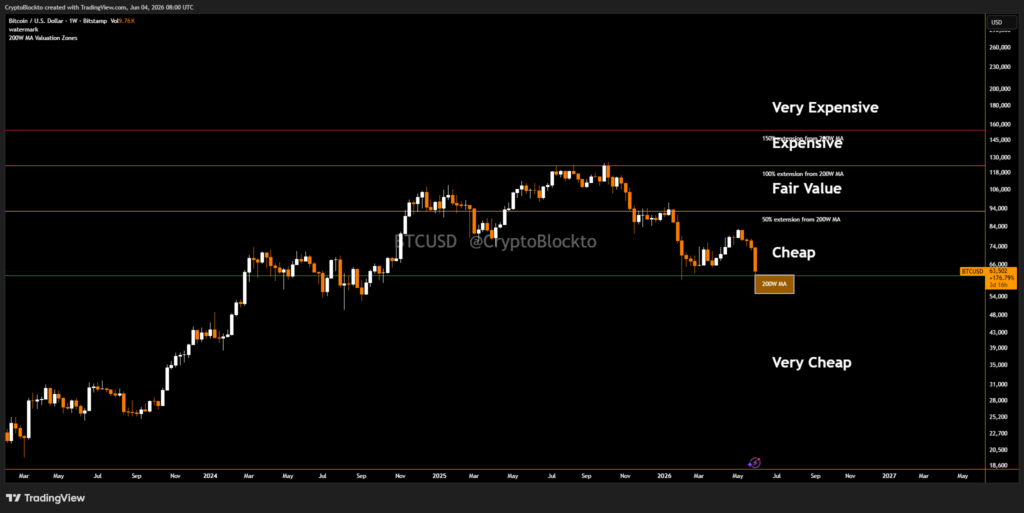
At the same time, Bitcoin remains above its 200-week simple moving average near $61,800, a level that has historically acted as a major bottom during previous market downturns. A sustained recovery from this support could strengthen the case for another push toward $70,000.
Live market reaction
Disclaimer
This content is for informational purposes only and does not constitute financial, investment, or legal advice. Cryptocurrency trading involves risk and may result in financial loss.
Start trading
with BloFin today
Up to $500 sign-up bonus and zero-fee trading on your first 30 days.
Buy crypto nowⓘ You will be redirected to BloFin
About the author
Emerging voice in crypto journalism with a background in fintech and digital economics. Covers DeFi, NFTs, and the evolving regulatory landscape.

Bitcoin Japan, Still Holding Zero BTC, Plans $60 Million Raise to Finally Make Purchase

US Regulators Miss Deadline for Finalizing Stablecoin Rules Under GENIUS Act

Tokenization Becomes Top Priority for 84% of Financial Institutions, Survey Finds