
Photo: Illustrative
Bitcoin Tests Historic Bear Market Support as Analysts Watch for Potential Rebound
Bitcoin has fallen back to one of its most important long term support levels after dropping to four month lows. The cryptocurrency recently touched its 200-week simple moving average (SMA), a technical indicator that has historically played a major role during previous market cycles.

Bitcoin has fallen back to one of its most important long term support levels after dropping to four month lows. The cryptocurrency recently touched its 200-week simple moving average (SMA), a technical indicator that has historically played a major role during previous market cycles.
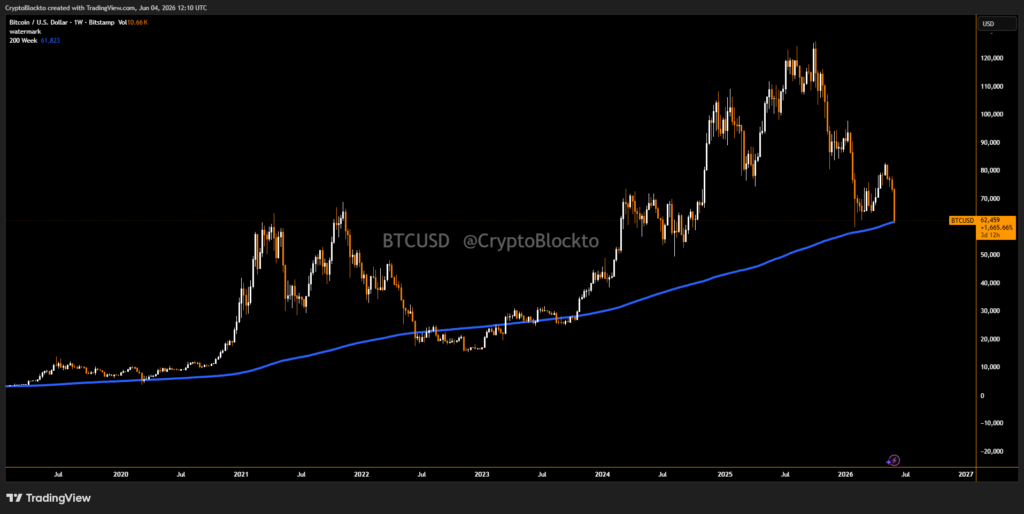
The 200-week SMA currently sits near $61,626 and marks the first time Bitcoin has revisited the level since October 2023. During the 2022 bear market, this same trend line acted as a strong resistance level before Bitcoin eventually regained upward momentum and entered a new recovery phase.
The return to the 200-week SMA as a significant moment for Bitcoin.There is a reasonable chance of a short term rebound due to the speed of the recent decline.
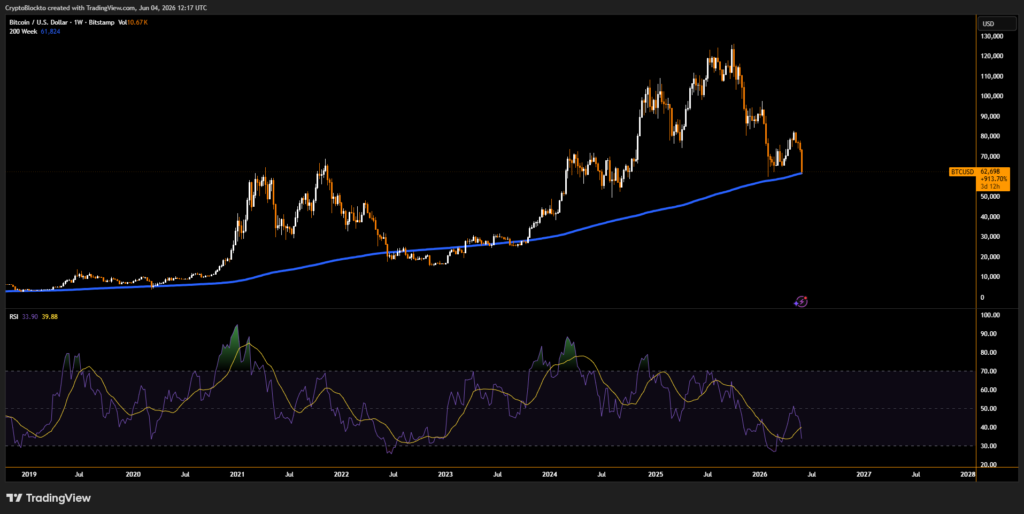
Bitcoin RSI Signals Extreme Oversold Conditions
Another factor attracting attention is Bitcoin’s Relative Strength Index (RSI), a commonly used momentum indicator. On the daily chart, the RSI recently dropped to 17.35, one of its lowest readings since 2020.
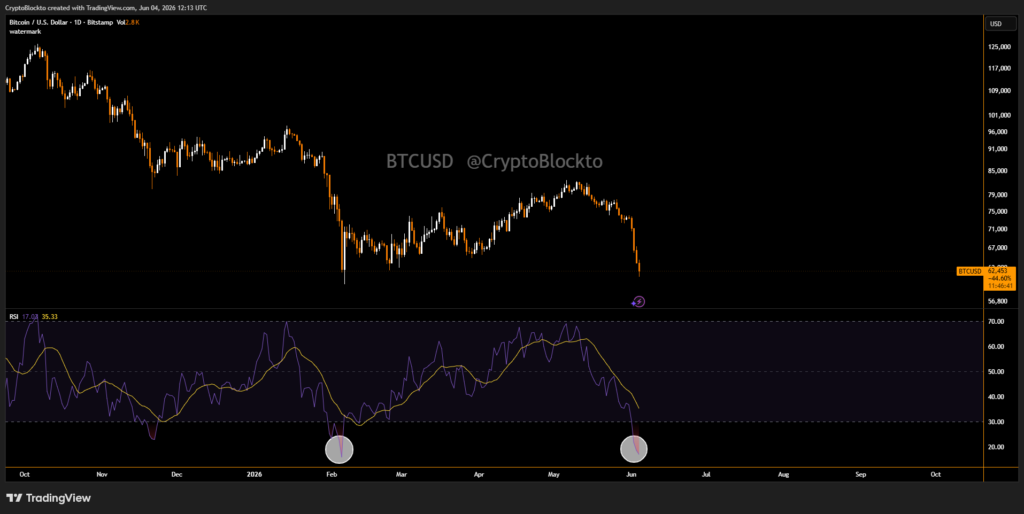
Such levels are generally considered extremely oversold and may indicate that selling pressure has become excessive. Several traders argue that these conditions often precede relief rallies or trend reversals.
The combination of the oversold RSI and Bitcoin’s return to the 200-week SMA makes the current zone attractive for investors who remain confident in Bitcoin’s long-term outlook.
Live market reaction
Disclaimer
This content is for informational purposes only and does not constitute financial, investment, or legal advice. Cryptocurrency trading involves risk and may result in financial loss.
Start trading
with BloFin today
Up to $500 sign-up bonus and zero-fee trading on your first 30 days.
Buy crypto nowⓘ You will be redirected to BloFin
About the author
8+ years covering crypto markets, macro, and geopolitics. Previously at Decrypt and CoinDesk. Focused on the intersection of digital assets and traditional finance.