


Photo: Illustrative
Bitcoin Faces Major Resistance Near $80,000 as ETF Buyers’ Cost Basis Aligns
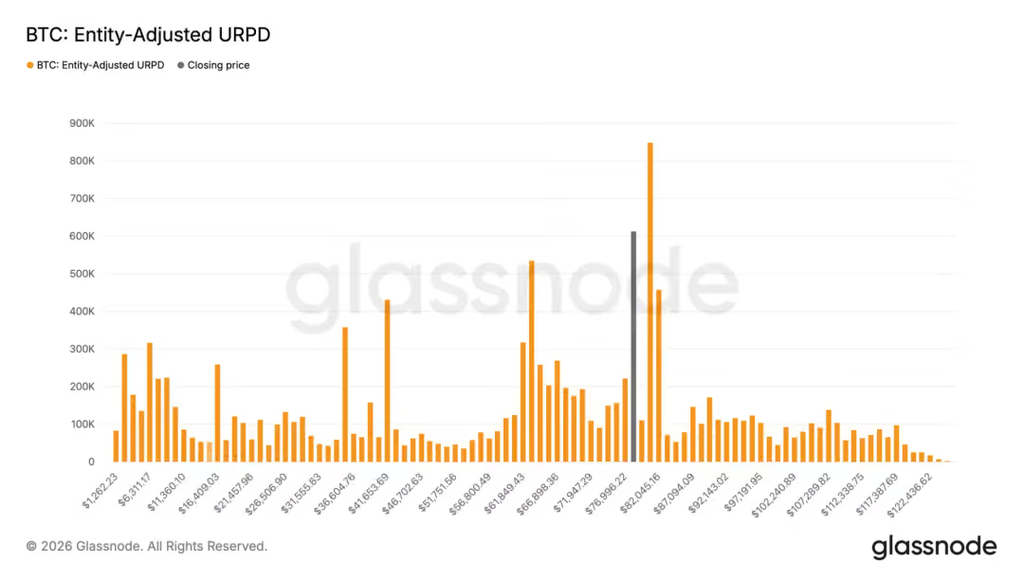
Bitcoin is running into its largest supply concentration yet as it approaches the $80,000 to $82,000 range, a zone where nearly 8% of all Bitcoin currently in circulation was originally acquired.
.jpeg)
Bitcoin is running into its largest supply concentration yet as it approaches the $80,000 to $82,000 range, a zone where nearly 8% of all Bitcoin currently in circulation was originally acquired.
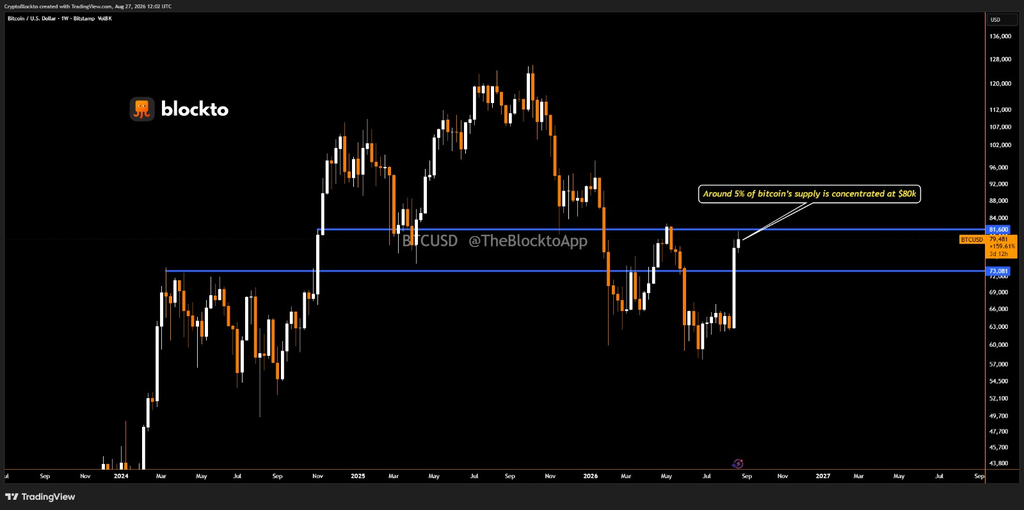
According to onchain data tracked through Glassnode’s realized price distribution metric, which maps where existing holders last moved their coins, roughly 5% of the total Bitcoin supply sits right at the $80,000 mark alone, making it the single largest cluster at any individual price point.
Why This Matters for the Rally
These price clusters are significant because investors who bought Bitcoin near these levels often look to sell once the price returns to their original purchase price, creating what analysts call overhead resistance. Adding to that pressure, the average cost basis for deposits into US spot Bitcoin ETFs also falls within this same $80,000 to $82,000 range, meaning a wave of ETF-driven selling could emerge alongside selling from long-term holders.
A Similar Pattern Played Out Before
A comparable setup previously formed between $60,000 and $63,000, where over 6% of supply was concentrated. That zone eventually became a strong support level after Bitcoin traded within that range for much of the year, briefly dipping below $60,000 during the summer before quickly reclaiming it.
A Key Technical Level Also in Play
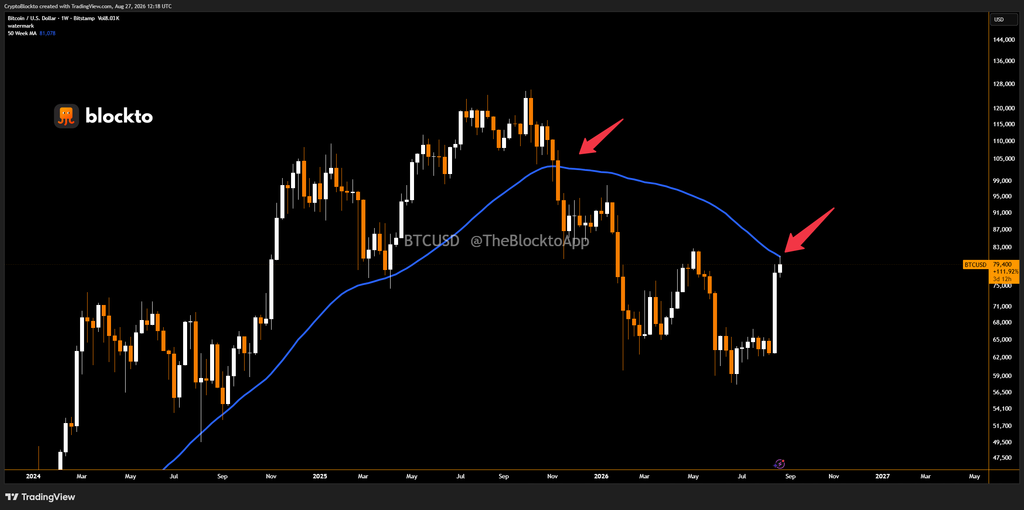
Bitcoin’s 50-week moving average, which tracks the average closing price over roughly the past year, currently sits at $81,081. The cryptocurrency has traded below this level since November 2025. Notably, the two previous times Bitcoin broke back above this trend line, in 2020 and 2023, both preceded extended bull market runs.
Live market reaction
Disclaimer
This content is for informational purposes only and does not constitute financial, investment, or legal advice. Cryptocurrency trading involves risk and may result in financial loss.
Start trading
with BloFin today
Up to $500 sign-up bonus and zero-fee trading on your first 30 days.
Buy crypto nowⓘ You will be redirected to BloFin
About the author
Emerging voice in crypto journalism with a background in fintech and digital economics. Covers DeFi, NFTs, and the evolving regulatory landscape.

 Guylian ·

.jpeg&w=32&q=75) Laurisa ·
Laurisa ·