


Photo: Illustrative
Bitcoin Nears 50-Day Mark on Key Bottom Indicator as Onchain Data Points to Bear Market’s Final Stage
Bitcoin has been tracking a well known onchain countdown for nearly two months, according to new research, as more than half of the circulating supply has been sitting at a loss since early June. Historical data shows that once this threshold is crossed, Bitcoin has typically reached its cycle bottom within roughly three months, based on patterns from previous bear markets.
.jpeg)
Bitcoin has been tracking a well known onchain countdown for nearly two months, according to new research, as more than half of the circulating supply has been sitting at a loss since early June. Historical data shows that once this threshold is crossed, Bitcoin has typically reached its cycle bottom within roughly three months, based on patterns from previous bear markets.
Current Cycle Marks Second-Longest Bottom Window on Record
Research from crypto analytics firm K33 shows this year’s countdown, which began June 5, has now stretched 42 days, making it the second-longest such window in Bitcoin’s history.
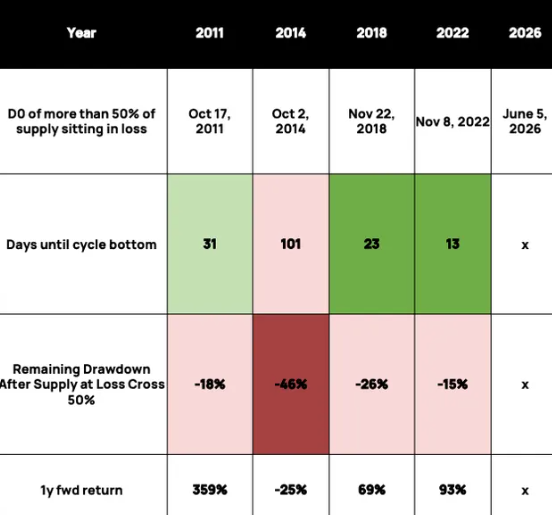
Previous cycles varied significantly, with some bottoms forming in as little as 13 days and others taking over 100 days. Analysts note that returns over the following year after this signal has historically been strong. Separate data from CryptoQuant currently places Bitcoin’s supply in loss at 46%.
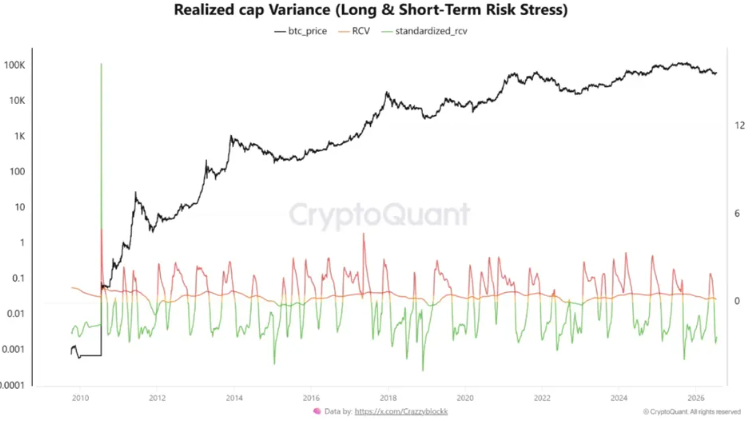
Additional onchain analysis pointed to unusual behavior in Bitcoin’s realized cap variance model, a metric that compares realized value to market value to gauge investor sentiment. The current reading sits in the bottom range of its historical distribution, suggesting that much of the excitement built during previous rallies has faded. Analysts noted that similarly extreme readings in past cycles, including in 2018 and 2022, preceded strong returns over the following year, with the most extreme historical reading occurring almost exactly at Bitcoin’s 2018 cycle low.
Live market reaction
Disclaimer
This content is for informational purposes only and does not constitute financial, investment, or legal advice. Cryptocurrency trading involves risk and may result in financial loss.
Start trading
with BloFin today
Up to $500 sign-up bonus and zero-fee trading on your first 30 days.
Buy crypto nowⓘ You will be redirected to BloFin
About the author
Emerging voice in crypto journalism with a background in fintech and digital economics. Covers DeFi, NFTs, and the evolving regulatory landscape.

.jpeg&w=32&q=75) Laurisa ·
Laurisa · 

 Tristan R. ·