Photo: Illustrative
Bitcoin Price Drops Toward $62,000 as Bear Market Pattern Continues
Bitcoin moved lower today, slipping below the $62,000 area as traders continued to assess whether the market has found a long term bottom. The decline came after another rejection near $64,200, increasing the possibility of a renewed test of the important $60,000 support level.
.jpeg)
Bitcoin moved lower today, slipping below the $62,000 area as traders continued to assess whether the market has found a long term bottom. The decline came after another rejection near $64,200, increasing the possibility of a renewed test of the important $60,000 support level.

Market analysts say Bitcoin remains under pressure despite improving sentiment surrounding potential peace talks between the United States and Iran. While broader financial markets showed strength, the crypto market continued to struggle with weak momentum.
Analysts Say $65,000 Remains the Key Level for Bulls
Bitcoin must reclaim $65,000 before buyers can regain control of the market. The level previously acted as support after the sharp correction earlier this year but has now turned into a major resistance zone.
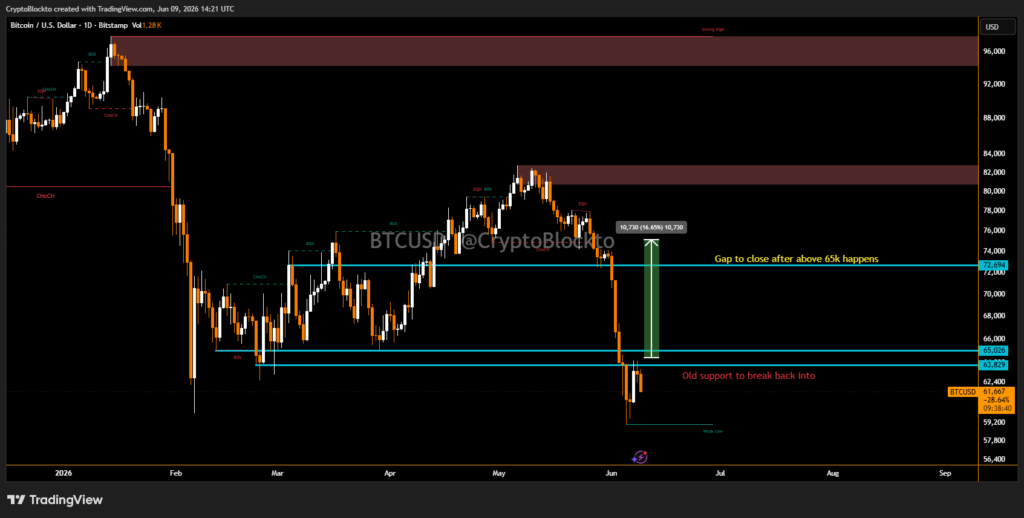
Asuccessful move above $65,000 could open the door for a stronger rally toward the $72,000 to $74,000 range. Last week’s decline to around $59,100 may have been an overreaction and questioned whether those lows will hold.
Bear Market Signals Mirror Previous Cycles
Bitcoin is showing similarities to previous bear markets in 2018 and 2022. BTC has fallen below its 50-month exponential moving average and broken down from a long-term triangle pattern, both of which appeared during earlier market downturns.
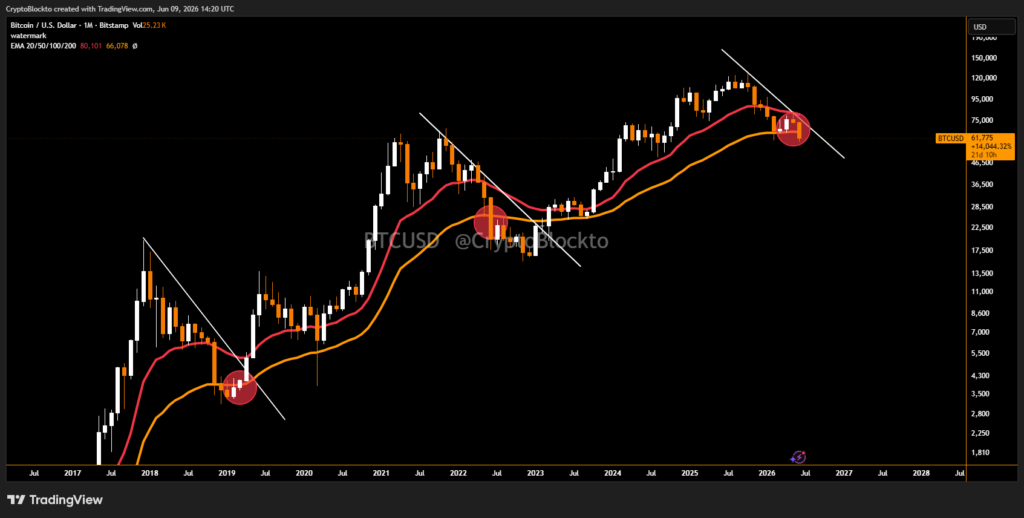
According to analysis, Bitcoin now needs to confirm this breakdown before a deeper phase of bearish acceleration can develop.
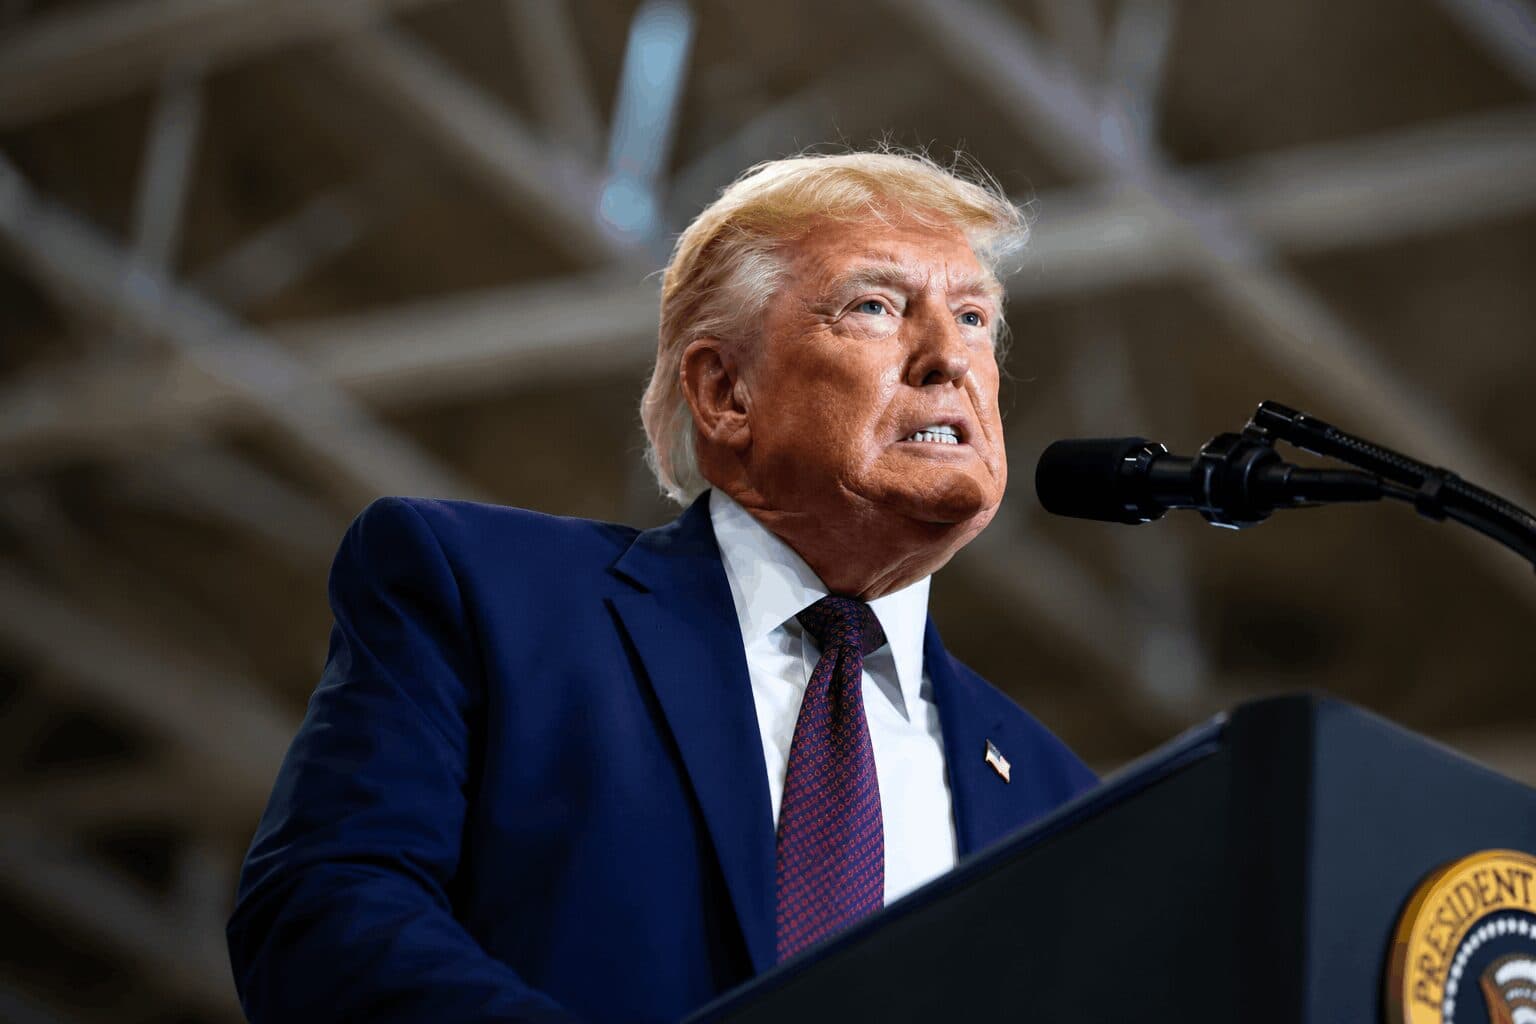
Oil Prices Fall as Iran Deal Hopes Improve
Outside the crypto market, oil prices declined as expectations for a possible US-Iran agreement increased. US President Donald Trump said he believes a deal could happen soon, helping push WTI crude oil below $88 per barrel for the first time since late May.
Despite gains in major stock indexes, Bitcoin continued to trade independently, highlighting ongoing caution among cryptocurrency investors as they wait for clearer signs of a market recovery.
Live market reaction
Disclaimer
This content is for informational purposes only and does not constitute financial, investment, or legal advice. Cryptocurrency trading involves risk and may result in financial loss.
Start trading
with BloFin today
Up to $500 sign-up bonus and zero-fee trading on your first 30 days.
Buy crypto nowⓘ You will be redirected to BloFin
About the author
Emerging voice in crypto journalism with a background in fintech and digital economics. Covers DeFi, NFTs, and the evolving regulatory landscape.